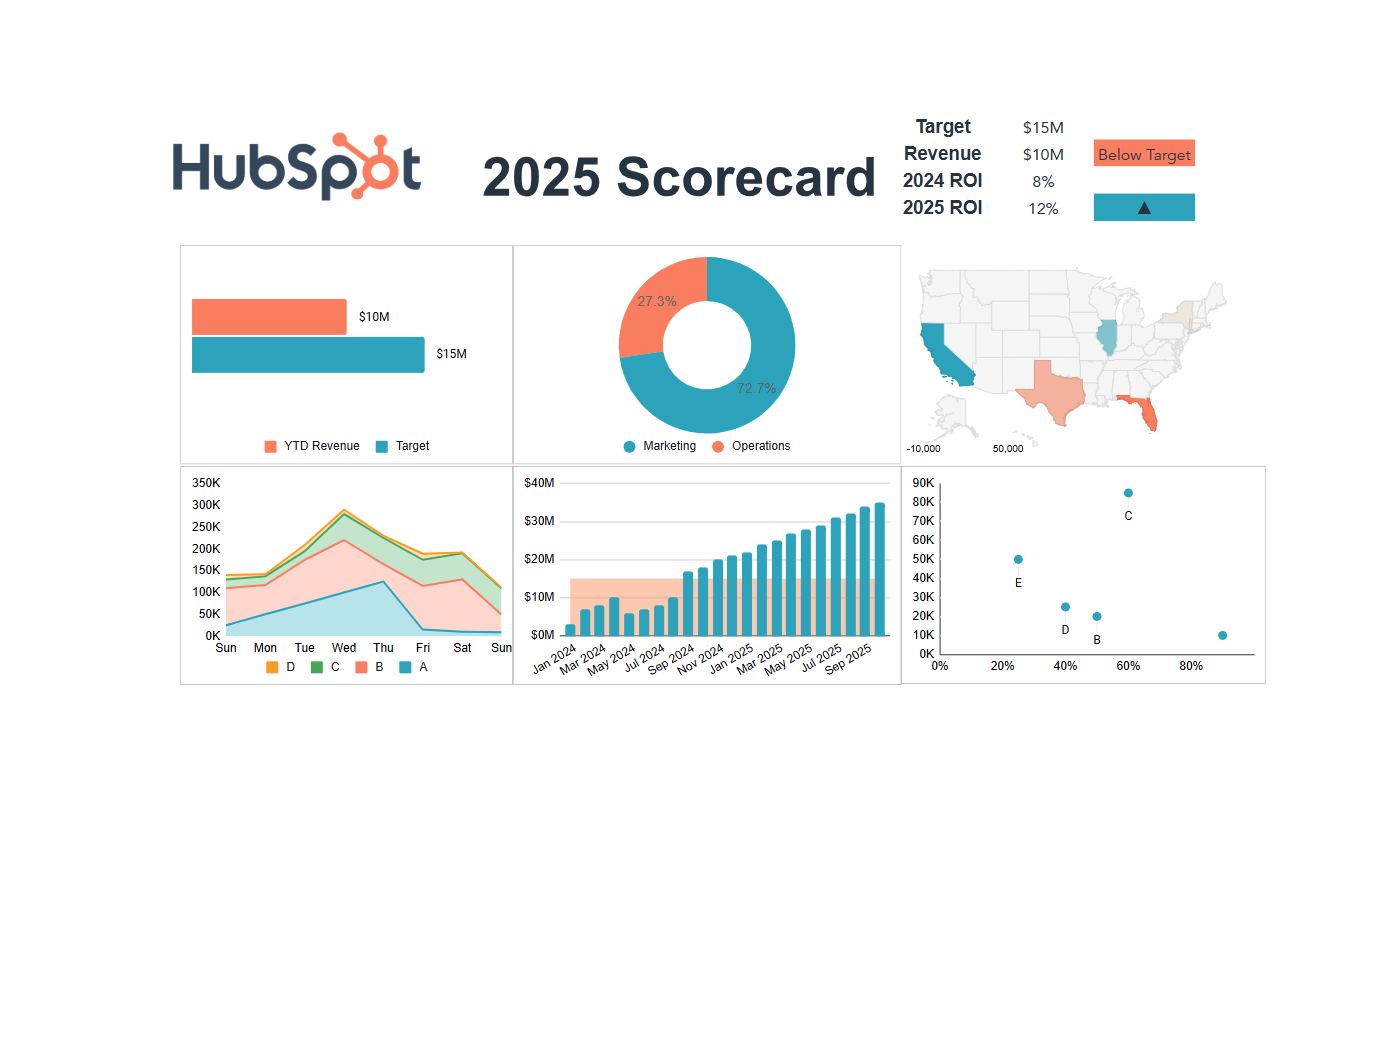
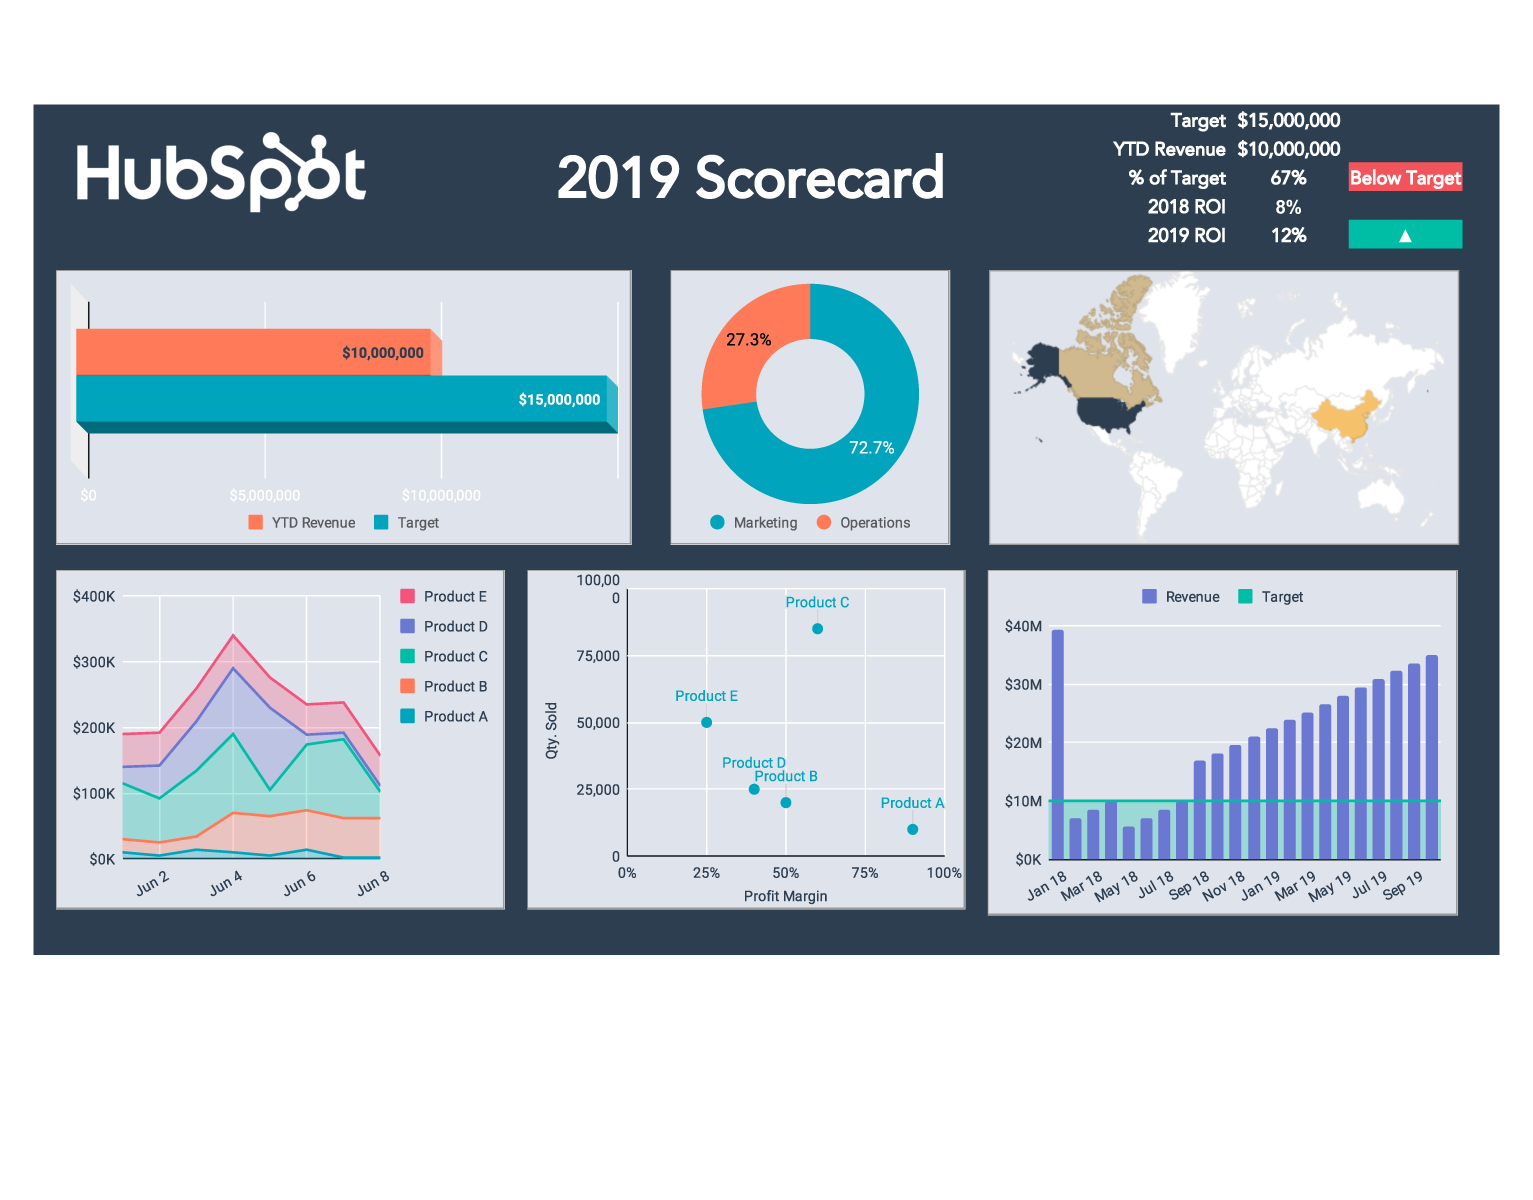
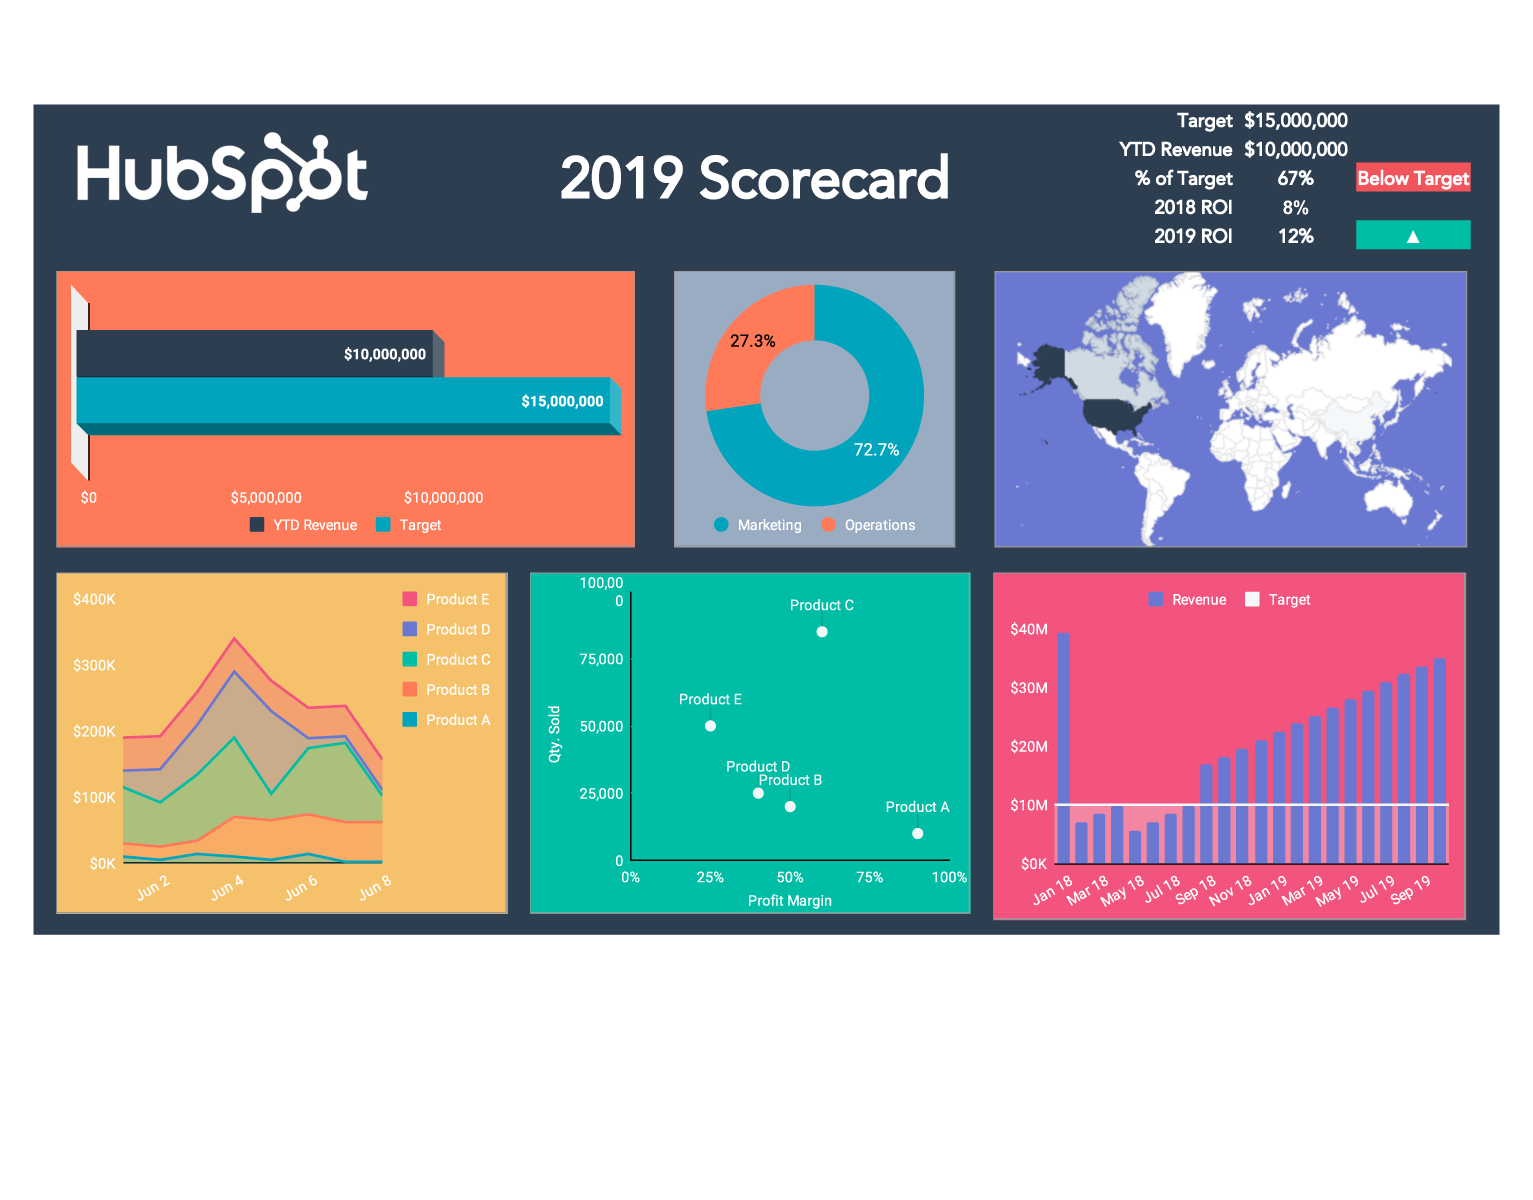
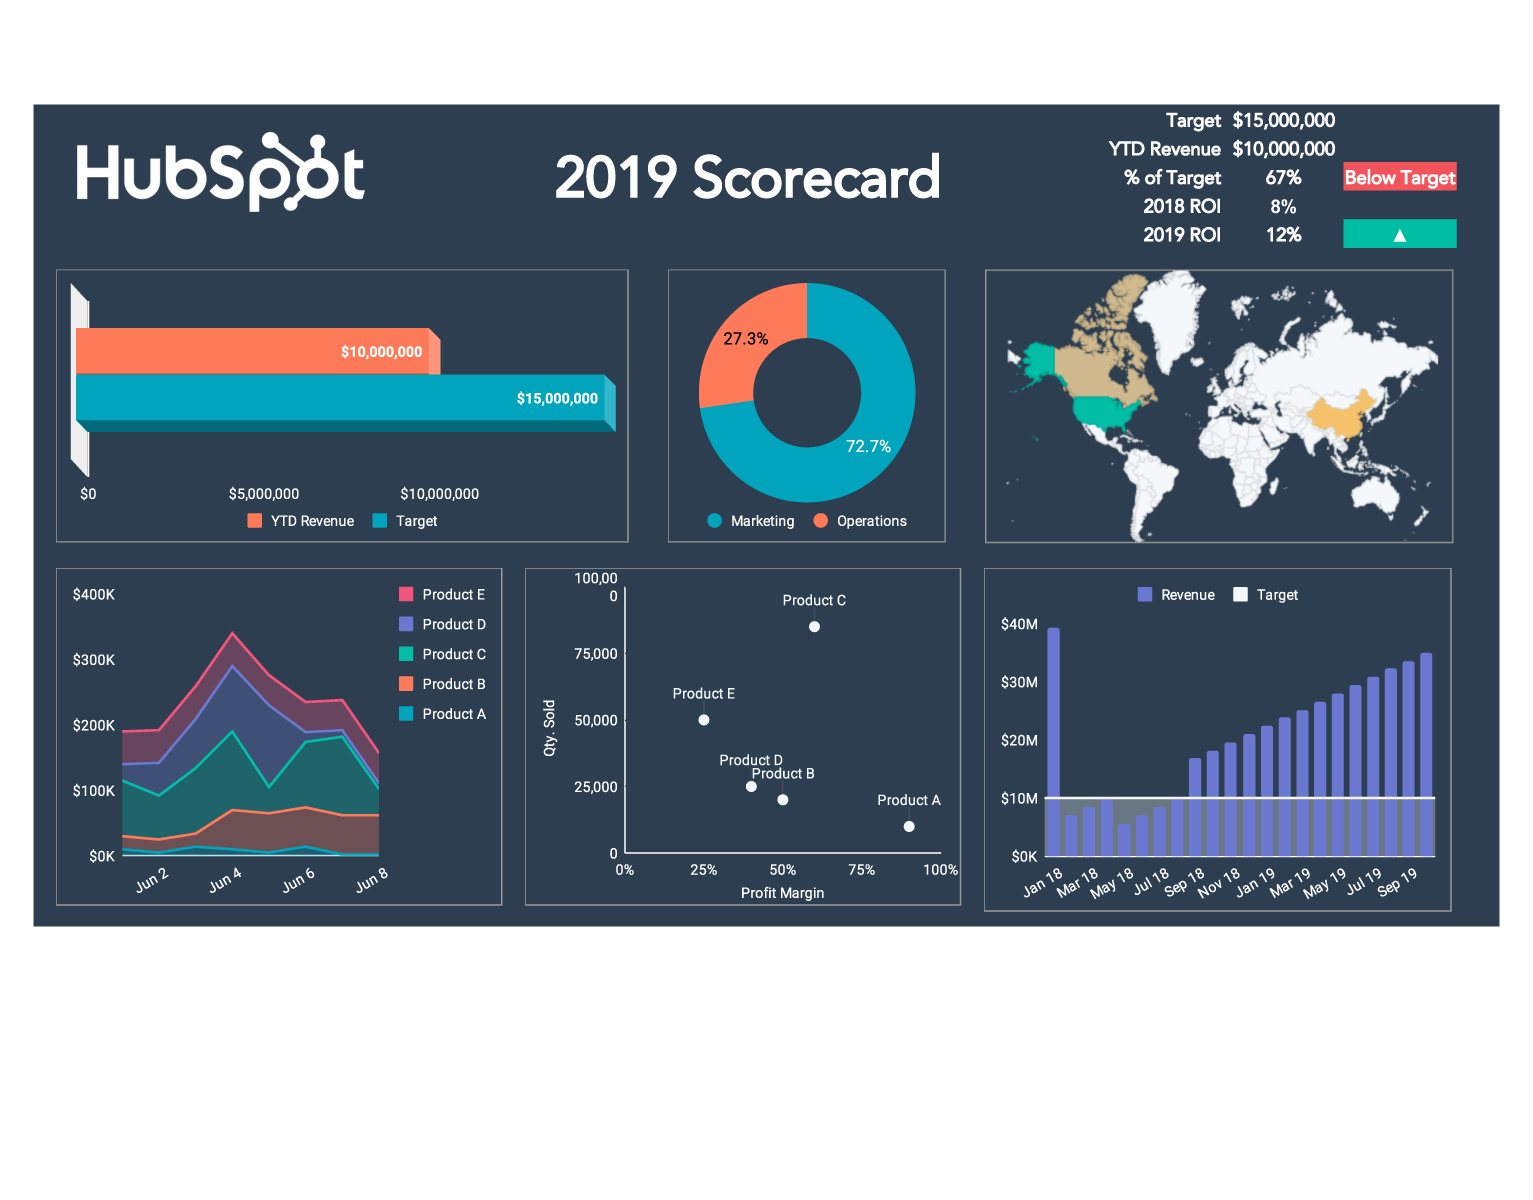
A KPI dashboard visualizes your most important business metrics in one place, helping you track performance, spot trends, and make data-driven decisions at a glance. Use this free template to learn which KPIs matter before automating with real-time dashboard software.
Join thousands of professionals using this template.
Set up in 20 minutes - choose metrics, input data, customize visuals
Works well for 3-6 months tracking 5-15 KPIs manually
Learn dashboard design fundamentals before investing in software
Easy upgrade path - import to HubSpot when manual updates take 2+ hours weekly
HubSpot’s KPI template can be opened with either Excel or a PDF viewer, all you have to do is download it in your preferred format.
Here’s how to use and edit your KPI dashboard in Excel:
Many businesses start with this Excel dashboard to learn KPI fundamentals, then transition to automated software within 3-6 months. Here's the difference:
Excel KPI Dashboard Template | HubSpot Automated Dashboards | |
Capacity | 5-15 KPIs, weekly/monthly updates | 20+ KPIs, real-time monitoring |
Data entry | Copy/paste from multiple sources manually | Automatic from connected systems |
Update frequency | Weekly or monthly (1-2 hours) | Real-time (automatic) |
Time investment | 1-2 hours/week updating data | 10 minutes/week reviewing |
Historical data | Limited to what you manually save | Automatically stored forever |
Team access | Email file or cloud storage | Live dashboards for entire team |
Data accuracy | Depends on manual updates | Always current from sources |
Cost | Free | Marketing/Sales Hub ($15-45/mo) |
5-10 KPIs maximum! It’s easy to get overwhelmed by the sheer amount of data that might be relevant to your business goals. To ensure you maintain focus on the most important performance metrics, choose only a limited number of KPIs. Before adding any KPI, ask yourself: "If this number changes, what action would we take?". If you can't answer clearly, remove it from your dashboard.
Next, you’ll want to add the relevant data to a KPI dashboard and review its visual elements, such as graphs and bar charts. A visually appealing KPI dashboard lets you get to the heart of KPI data quickly to start putting it to work.
What makes an effective KPI dashboard?
A KPI dashboard isn't just pretty charts - it's a decision-making tool. An effective dashboard must have:
Use this OKR template to set aggressive, ambitious goals for your company that are tied to key results.
A CRM template is a great way to start tracking leads, interactions, and contact details in the sales process. Here is a free customizable CRM template.
Want to ensure you follow every lead and improve your conversion rates? Download our free lead tracking spreadsheet and fill it with information on promising prospects.
Describe the how, what, and where of your organizational tasks to employees with this free SOP template.
Use our free action plan template to help get your business or project goals off the ground.
Looking to develop a strategic plan for your business? Our simple strategic planning template can get you started.
Provide a professional, concise summary of project activities with this monthly report template.
Still tracking your sales data in a simple spreadsheet? Our sales dashboard template offers graphics and quick views that can save time and improve performance.
Conduct thorough assessments of your current state vs. goals with this free gap analysis template.
Use this free root cause analysis template to identify the source of business issues and create a plan to prevent them.
Make a case for an upcoming project or investment with the help of this free business case template.
Get the template for free!
Available for Excel & PDF