• HubSpot Logo

Fishbone Diagram - Excel, Google Sheets

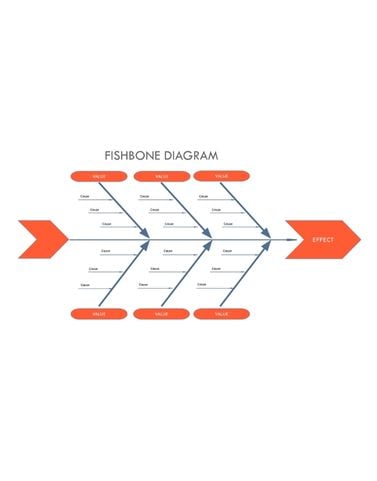
Identify a problem's root causes efficiently with a fishbone diagram. This visualization template categorizes potential causes, making it a valuable resource for root cause analysis.

Join thousands of professionals using this resource.

Frequently Asked Questions

A fishbone diagram, also known as a cause-and-effect diagram or an Ishikawa diagram, is a visual tool used to identify and analyze the potential causes of a problem or an outcome. It helps to explore the various factors contributing to the problem or result.

The fishbone diagram consists of three key components:
  • The Problem: This is the issue or effect you’re analyzing, written at the head of the fish.
  • The Spine: This is the long, horizontal line connecting to the head, serving as the timeline or sequence of the problem.
  • The Bones: These are the categories of potential causes. They branch off the spine, leading towards the head. These categories include methods, machines (equipment), people (manpower), materials, measurement, and environment.

You can use the fishbone diagram template when you need to analyze and categorize potential causes, understand the underlying root causes, and develop effective solutions for a problem or issue. It is beneficial in situations involving problem-solving, quality improvement, process analysis, team collaboration, and proactive planning.

The benefits of using a fishbone diagram include visualizing all potential causes in a structured manner, promoting team collaboration and brainstorming, uncovering hidden or less-obvious issues, identifying relationships between causes and effects, and prioritizing areas for improvement.

Yes, this template is completely free.

Yes, this template is editable. You can make changes based on your needs.

See other Business Templates