• HubSpot Logo

KPI Dashboard - Excel, PDF

A KPI dashboard visualizes your most important business metrics in one place, helping you track performance, spot trends, and make data-driven decisions at a glance. Use this free template to learn which KPIs matter before automating with real-time dashboard software.

Join thousands of professionals using this template.

HubSpot’s KPI template can be opened with either Excel or a PDF viewer, all you have to do is download it in your preferred format. 

Here’s how to use and edit your KPI dashboard in Excel:

  1. Download the KPI template for Excel and click Enable Editing.
  2. Review the visual elements in tabs 1–4 before adding your own data.
  3. In the Instructions tab, you’ll find instructions on how to use the KPI dashboard. Follow these carefully to ensure your dashboard looks and functions as expected.
  4. Change the values in the Instructions tab to your company’s KPI results. The changes will automatically be applied to your dashboard’s visual elements, such as graphs and charts.
  5. Print the KPI dashboard, send it to colleagues via email, or add it to meeting slides.


Many businesses start with this Excel dashboard to learn KPI fundamentals, then transition to automated software within 3-6 months. Here's the difference:

  Excel KPI Dashboard Template HubSpot Automated Dashboards
Capacity 5-15 KPIs, weekly/monthly updates 20+ KPIs, real-time monitoring
Data entry Copy/paste from multiple sources manually Automatic from connected systems
Update frequency Weekly or monthly (1-2 hours) Real-time (automatic)
Time investment 1-2 hours/week updating data 10 minutes/week reviewing
Historical data Limited to what you manually save Automatically stored forever
Team access Email file or cloud storage Live dashboards for entire team
Data accuracy Depends on manual updates Always current from sources
Cost Free Marketing/Sales Hub ($15-45/mo)


5-10 KPIs maximum! It’s easy to get overwhelmed by the sheer amount of data that might be relevant to your business goals. To ensure you maintain focus on the most important performance metrics, choose only a limited number of KPIs. Before adding any KPI, ask yourself: "If this number changes, what action would we take?". If you can't answer clearly, remove it from your dashboard.

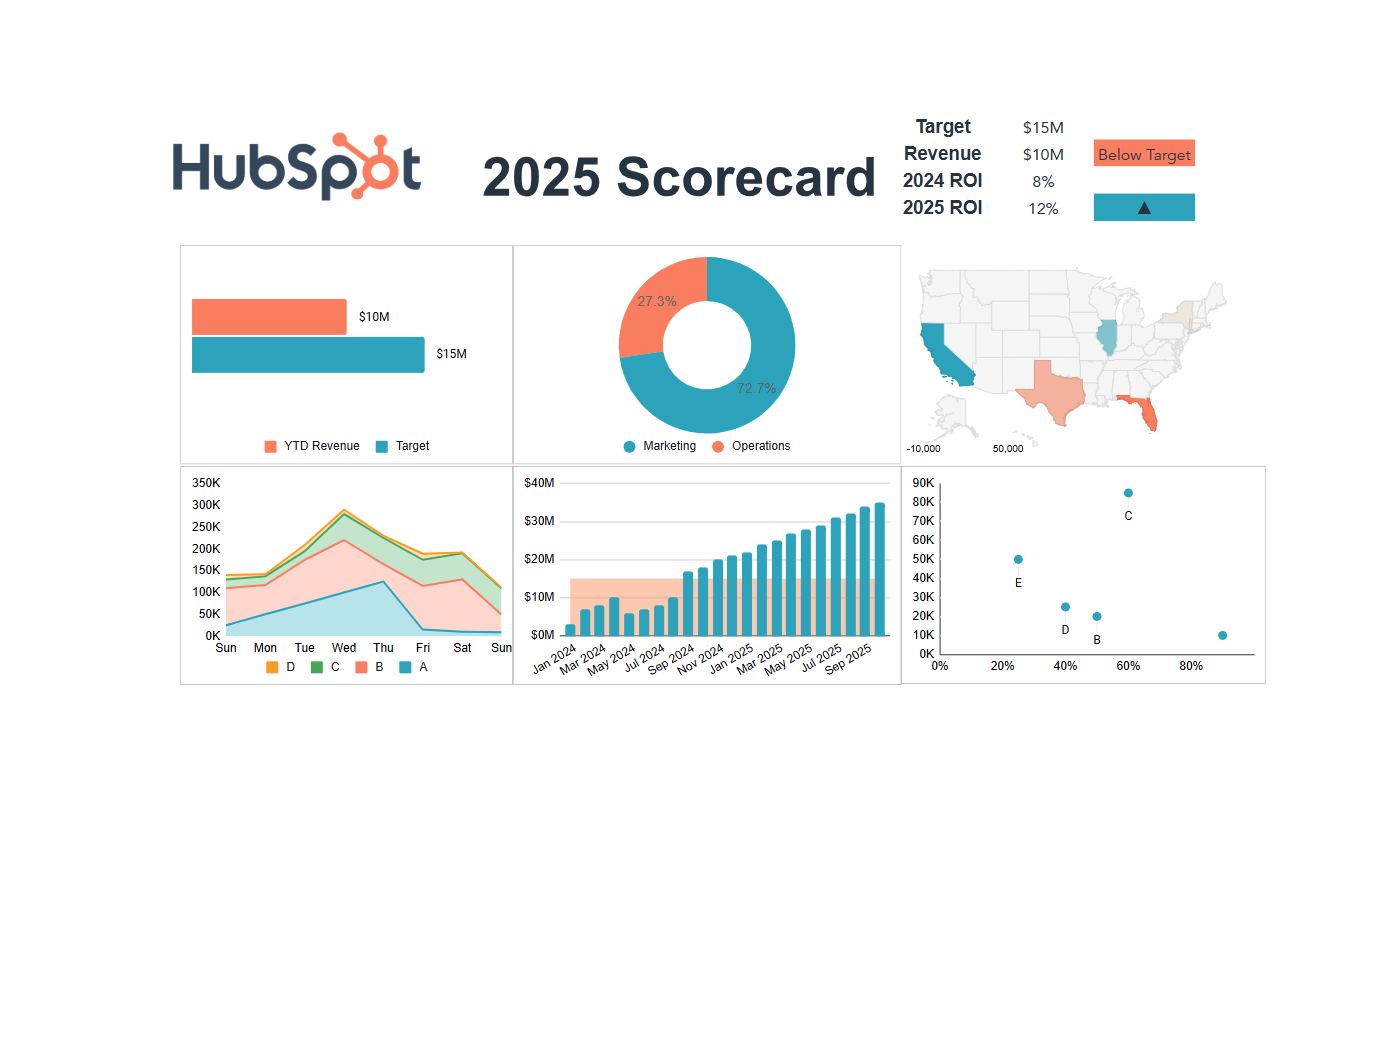
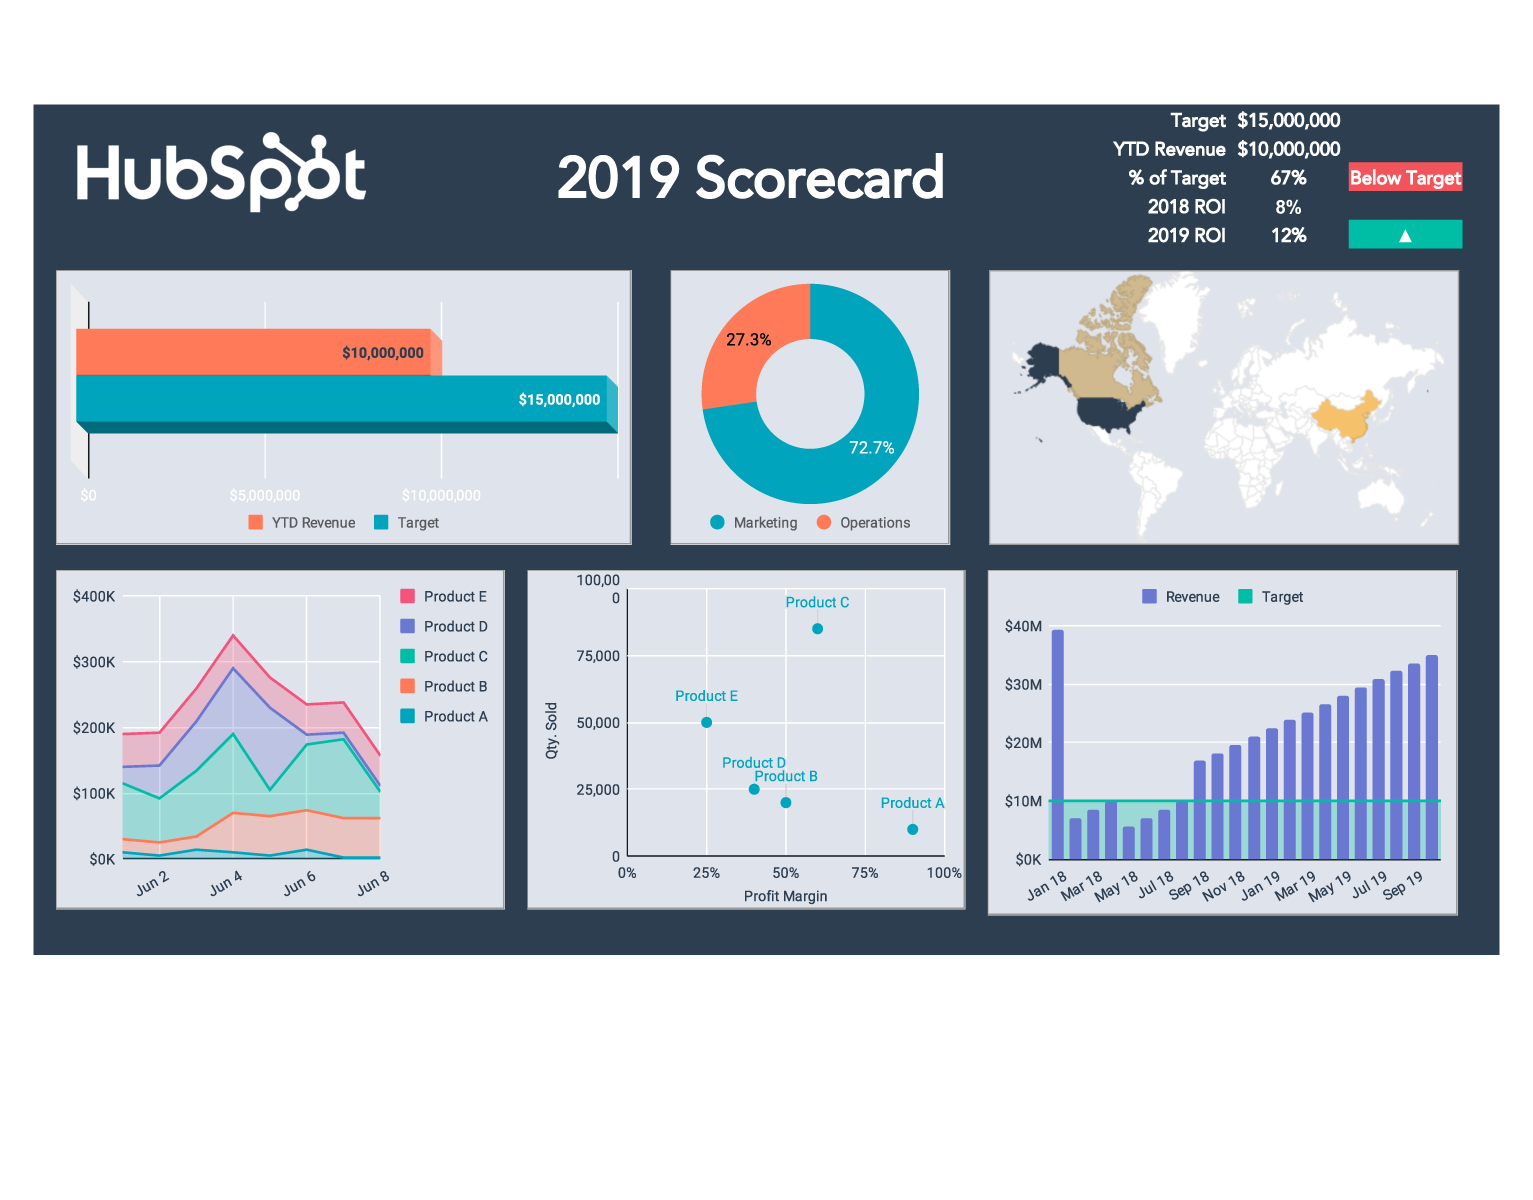
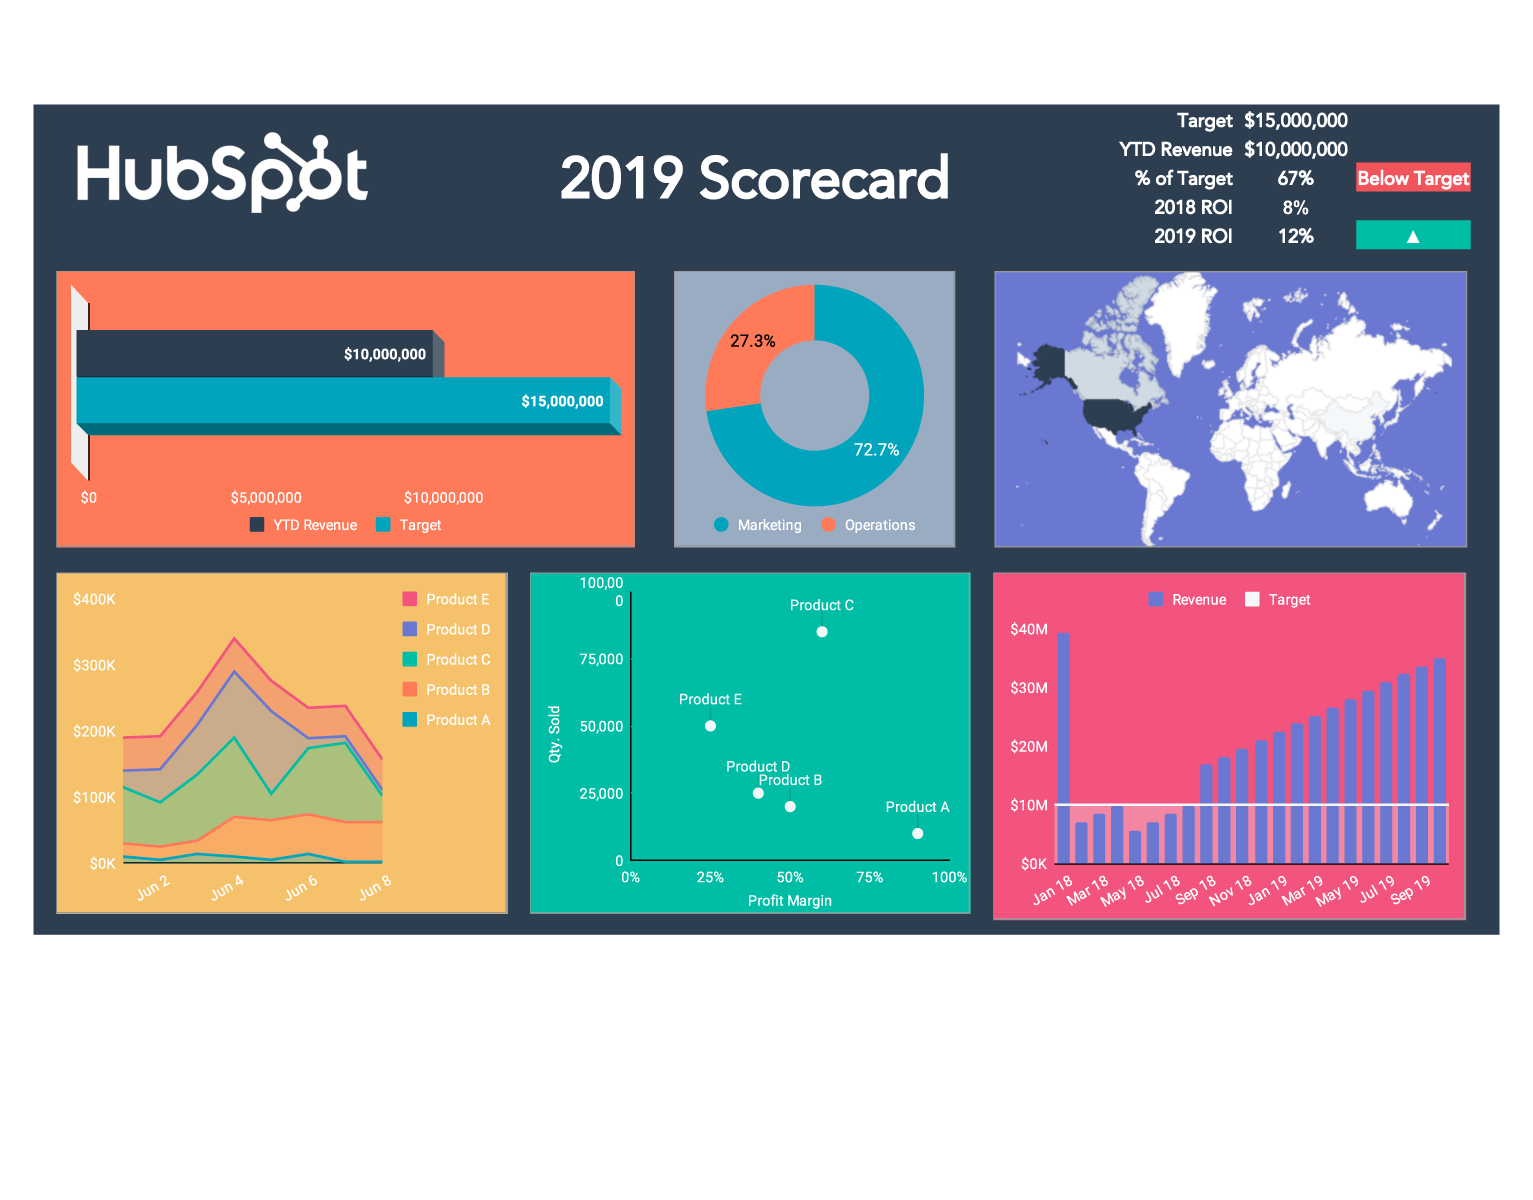
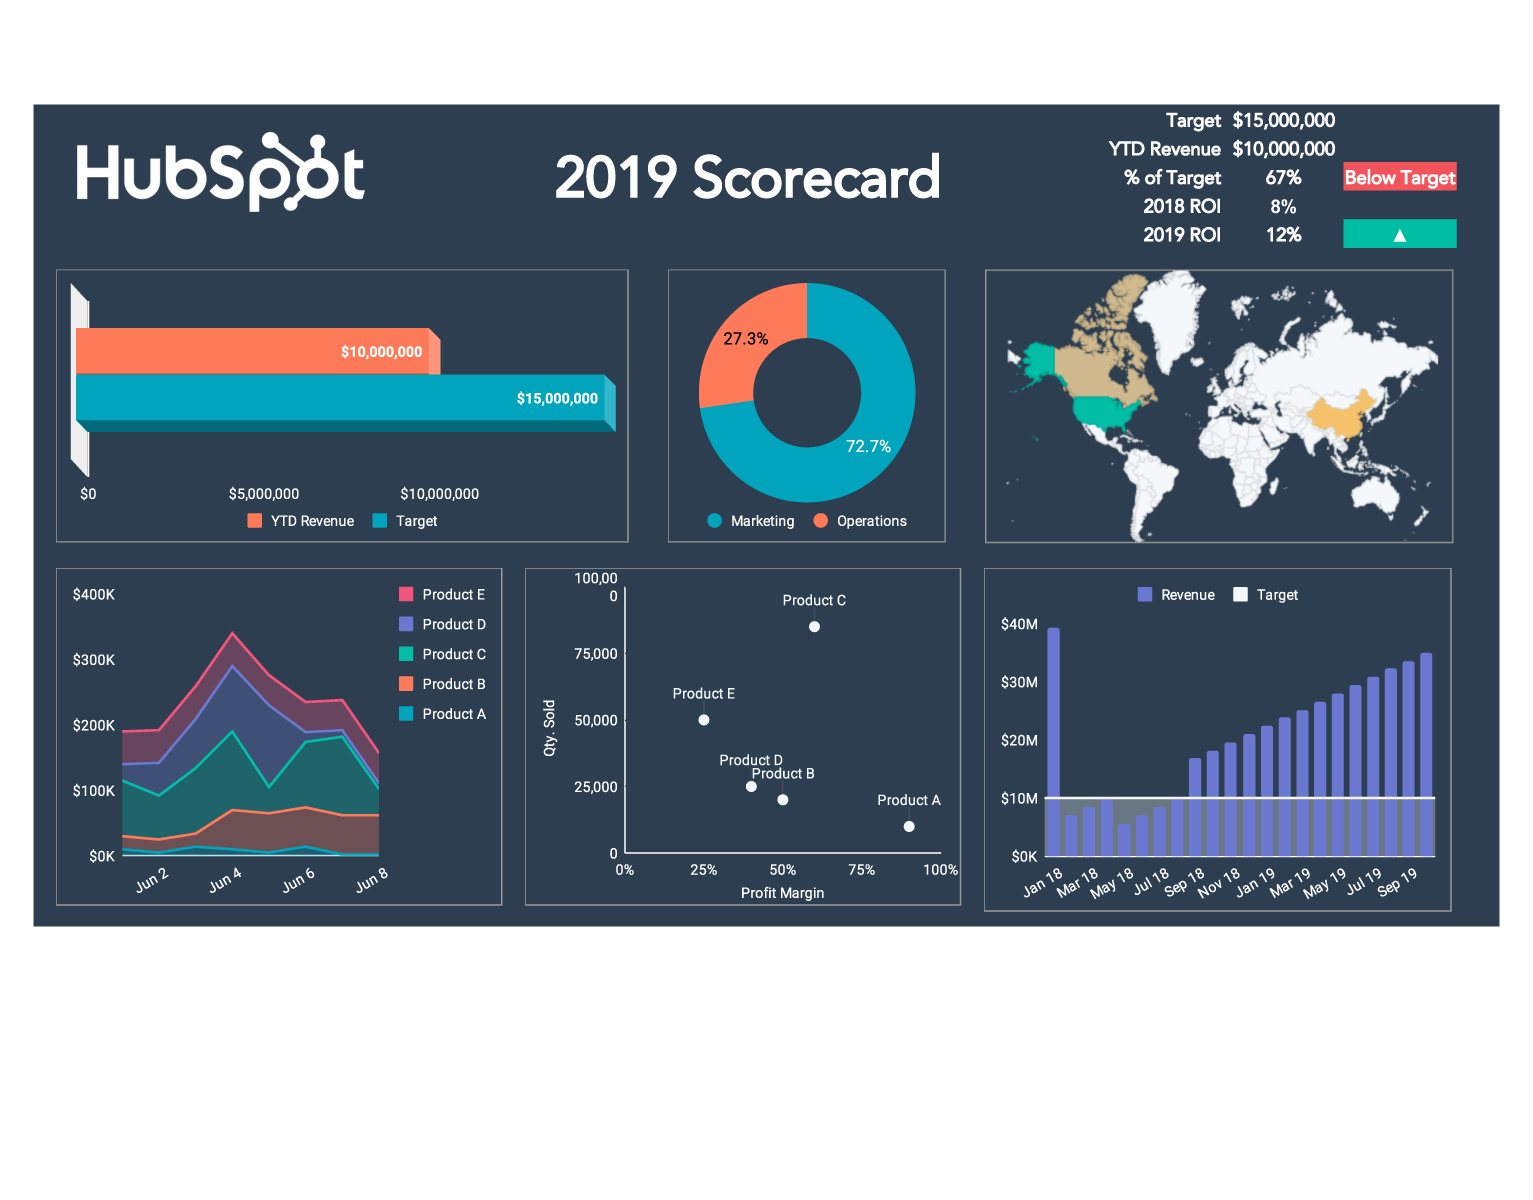
Next, you’ll want to add the relevant data to a KPI dashboard and review its visual elements, such as graphs and bar charts. A visually appealing KPI dashboard lets you get to the heart of KPI data quickly to start putting it to work.

What makes an effective KPI dashboard? 

A KPI dashboard isn't just pretty charts - it's a decision-making tool. An effective dashboard must have:

  • 5-10 focused metrics: Too many metrics create confusion instead of clarity. Choose metrics that drive specific actions when they change. 
  • Visual clarity for 30-second scanning: Use charts, gauges, and color coding (red/yellow/green) so you understand status instantly without reading tables of numbers.
  • Current value + target + trend: Show where you are now, where you want to be, and whether you're improving. All three pieces together drive action. 
  • Regular updates (weekly or monthly): A dashboard with month-old data is useless. Set a schedule and stick to it - consistency matters more than perfection. 
  • Metrics you can actually influence: If a number goes down and you can't do anything about it, it doesn't belong on your dashboard. Every KPI should be actionable.

Frequently Asked Questions

KPI is an acronym for "key performance indicator." KPIs are used for performance measurement in a business. They help to measure the success of the organization in a particular area. Typical areas that KPIs cover include: revenue, new customers, geographical area covered, market share, and customers retained.

Depending on your business operations, you could monitor your KPIs daily, weekly, or monthly. Just remember to update your KPI dashboard when new KPI data becomes available. 

Your main KPIs will depend on your business and its goals. KPIs can be financially motivated, customer-oriented, or outcome-focused.

For example, you may want to boost revenue, retain customers, or gain a competitive advantage.

Yes, but without good design skills, your dashboard may not be as effective or visually appealing.

All of our templates are freebies! Once you’ve entered your contact information, you can instantly download this template (along with all the other templates in this collection!). That’s it.

See other Business Templates

These are templates provided for your convenience and use. Nothing on this page creates an attorney client relationship and is not legal advice. If you want professional information, please consult your own attorney.

Get the template for free!