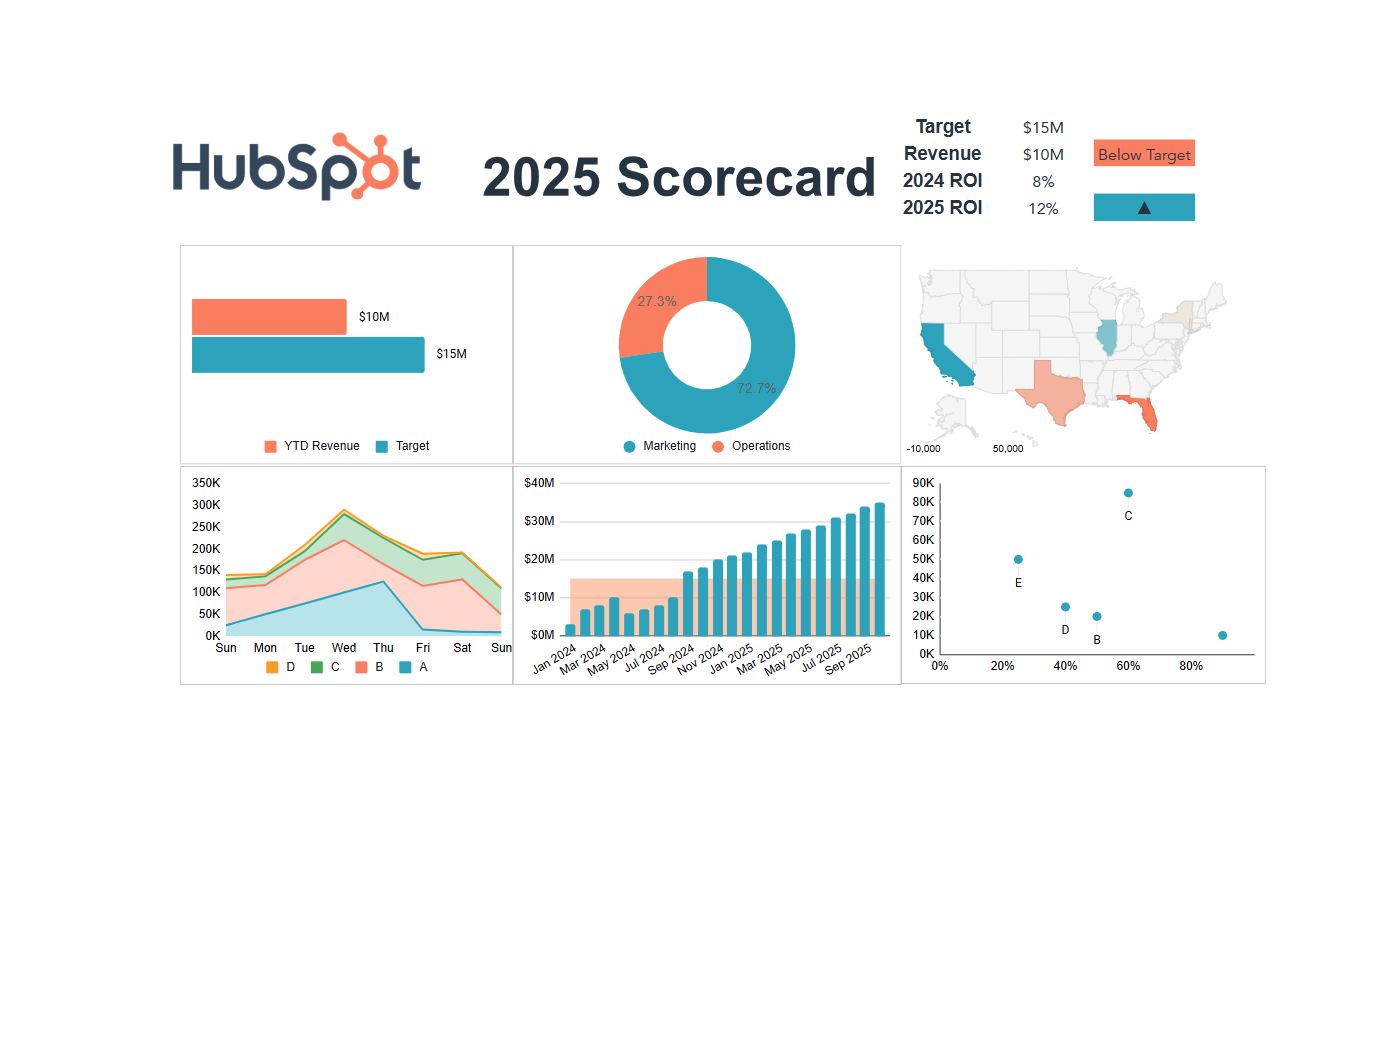
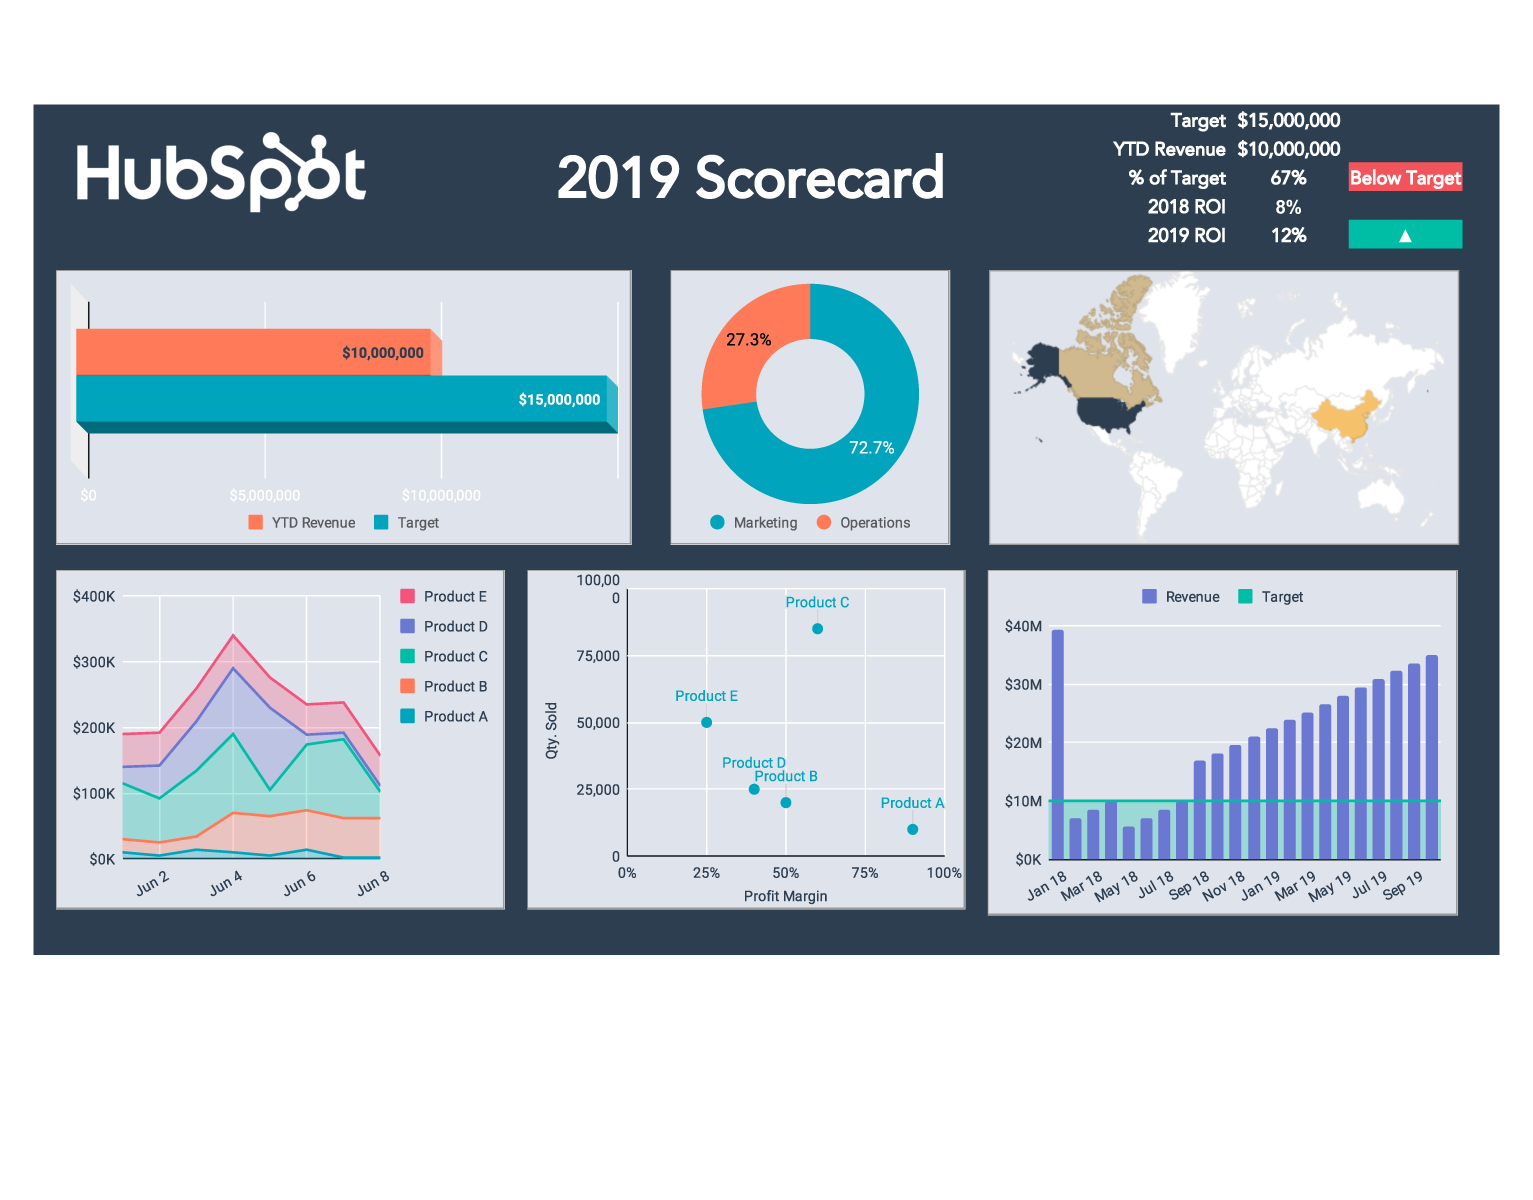
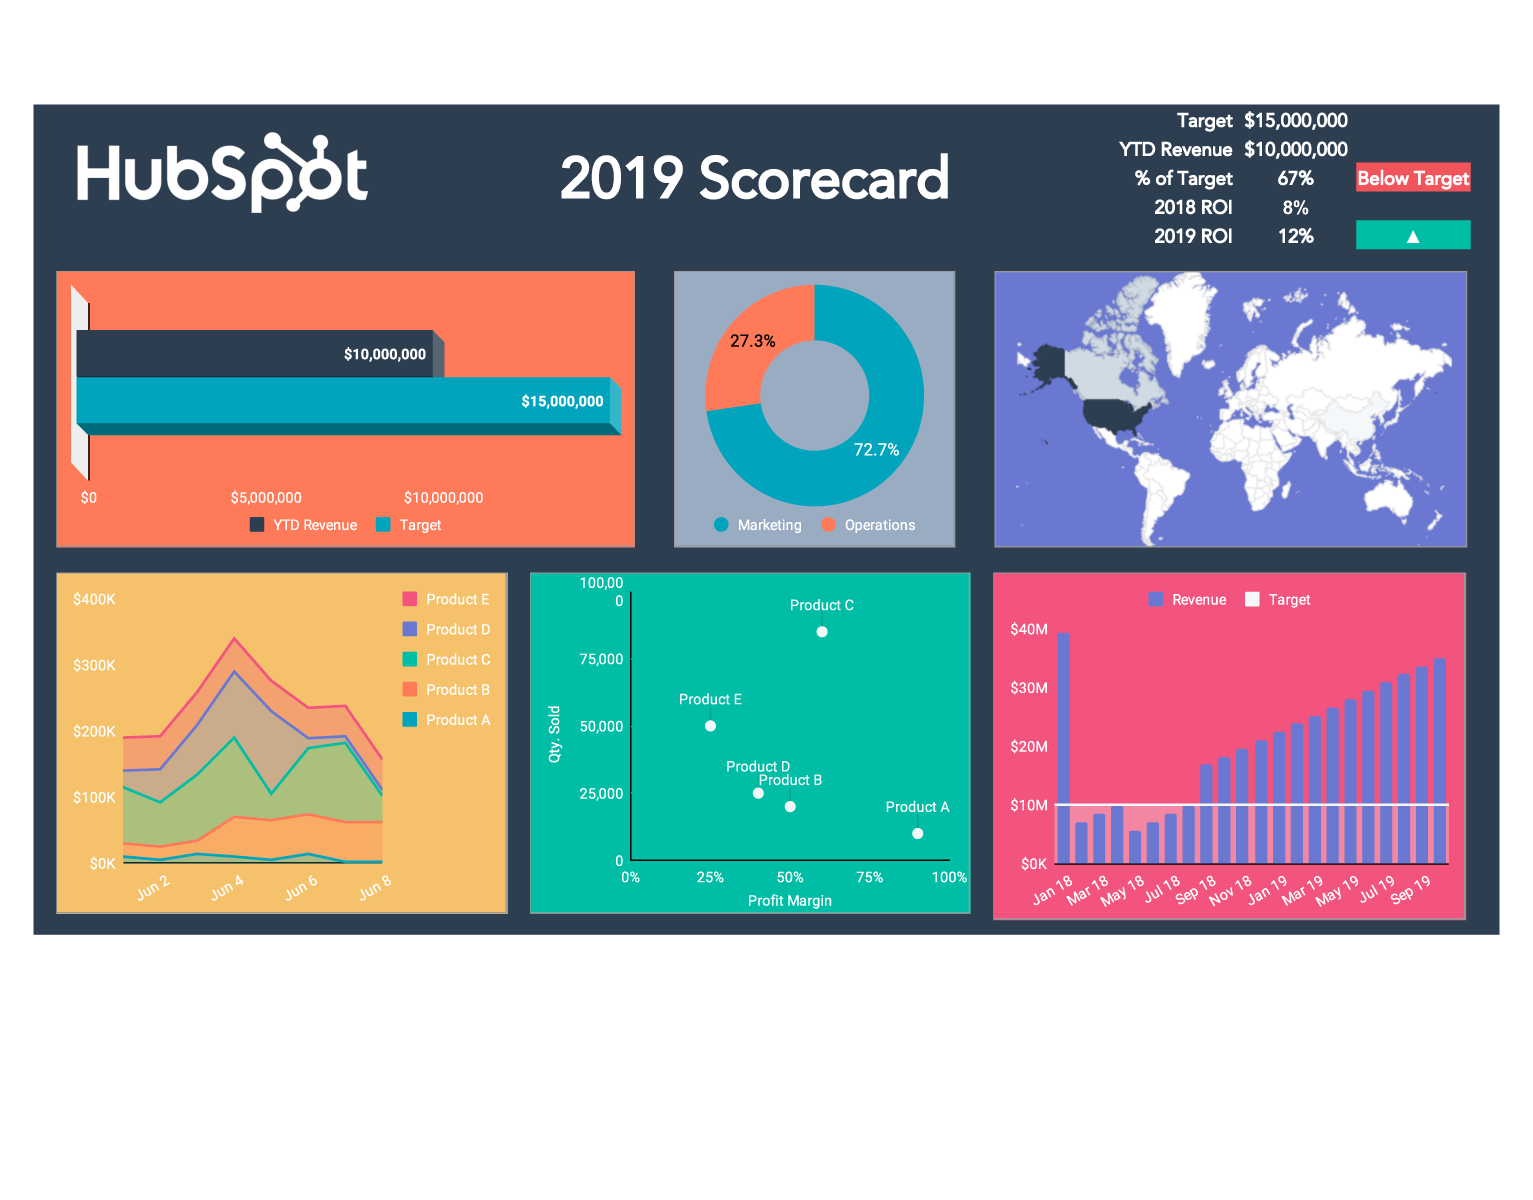
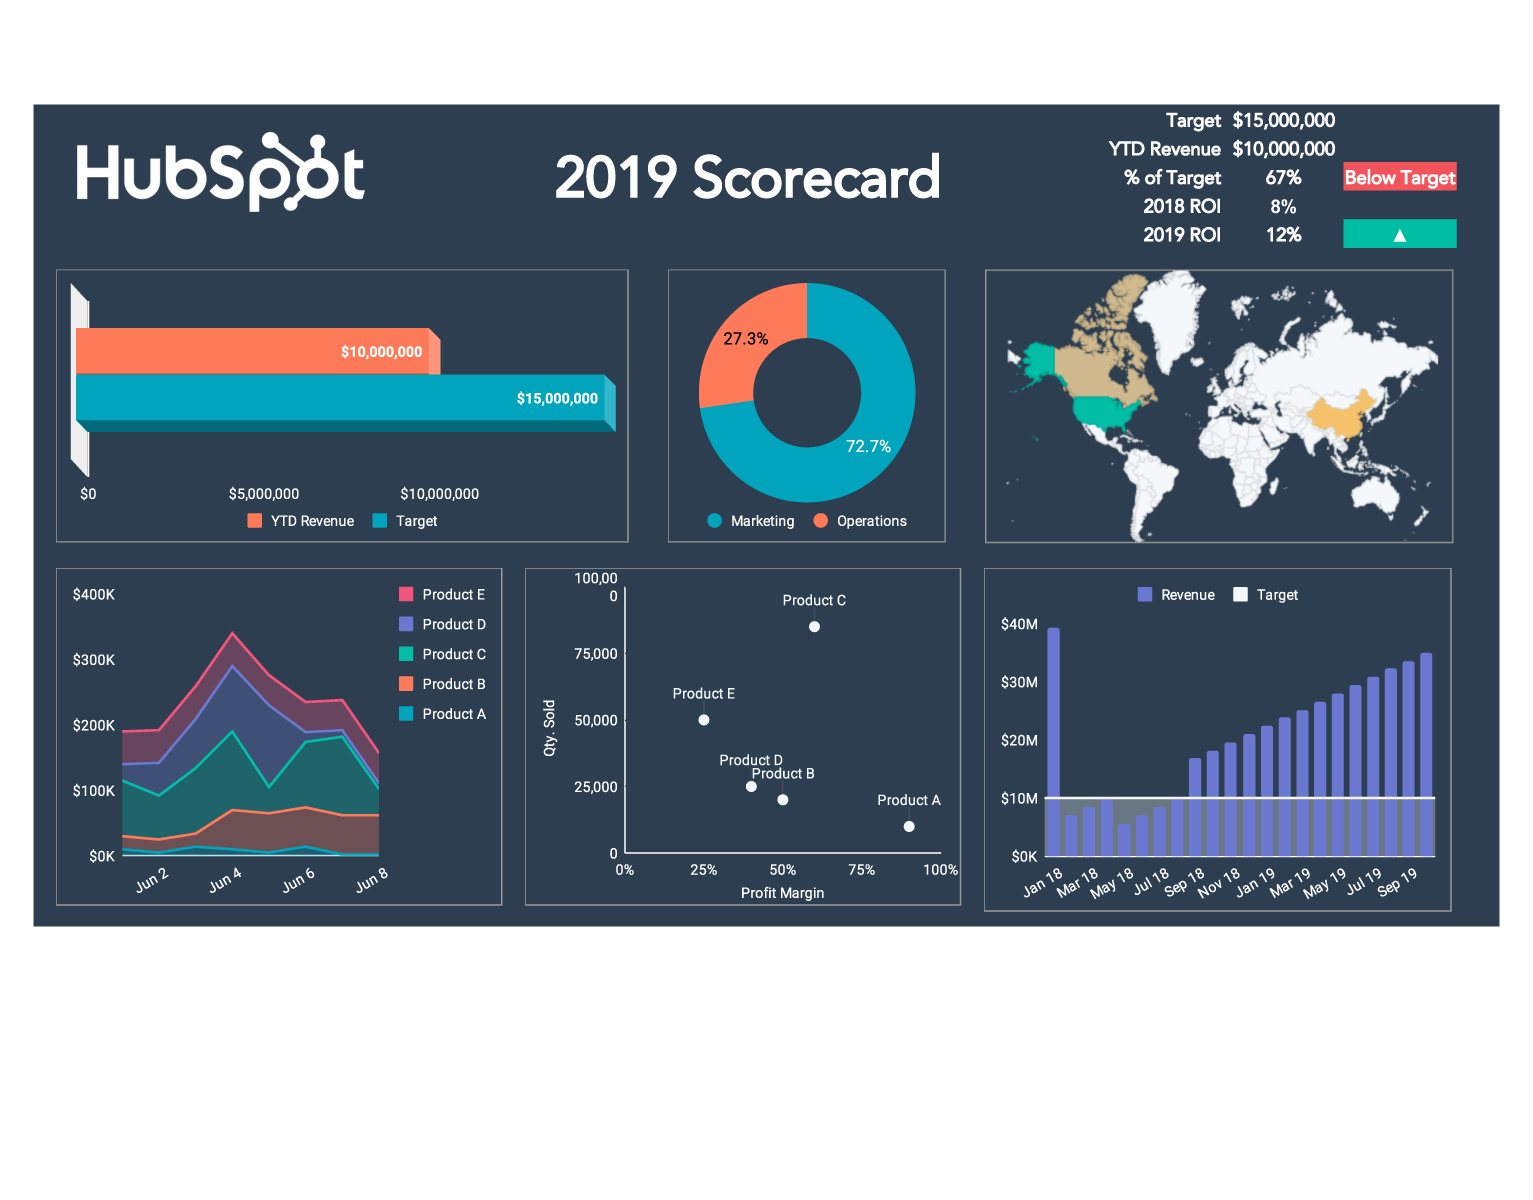
Examples of KPI Reports by Department
A KPI report template varies by function. Here's what each department typically tracks and how their dashboards differ:
Marketing KPI dashboard (Excel template): A marketing KPI excel template typically tracks lead volume by channel, MQL-to-SQL conversion rate, cost per lead, email open rates, and campaign ROI. Social media KPI tracking sheets add follower growth, engagement rate, reach, and click-through rate by platform.
Sales KPI dashboard: Sales KPI tracking templates focus on pipeline value, quota attainment percentage, win rate, average deal size, and days-to-close. Daily KPI reports for sales teams often include activity metrics: calls made, emails sent, and demos scheduled.
Customer service KPI Excel template: Customer service dashboards track first response time (FRT), average resolution time, CSAT score, ticket volume by category, and escalation rate. These metrics feed directly into staffing and SLA decisions.
Project management KPI template (Excel): Project management KPI templates include on-time delivery rate, budget variance, milestone completion percentage, open risk items, and resource utilization. These are particularly useful for reporting to stakeholders outside the project team.
Warehouse KPI template (Excel): Warehouse and operations KPI dashboards cover order accuracy rate, inventory turnover, fulfillment cycle time, pick-and-pack efficiency, and shrinkage rate. A warehouse KPI template in Excel works well for weekly performance reviews before investing in WMS integrations.
Maintenance KPI dashboard (Excel template): Maintenance teams track mean time between failures (MTBF), mean time to repair (MTTR), planned vs. reactive maintenance ratio, and asset downtime percentage.