• HubSpot Logo

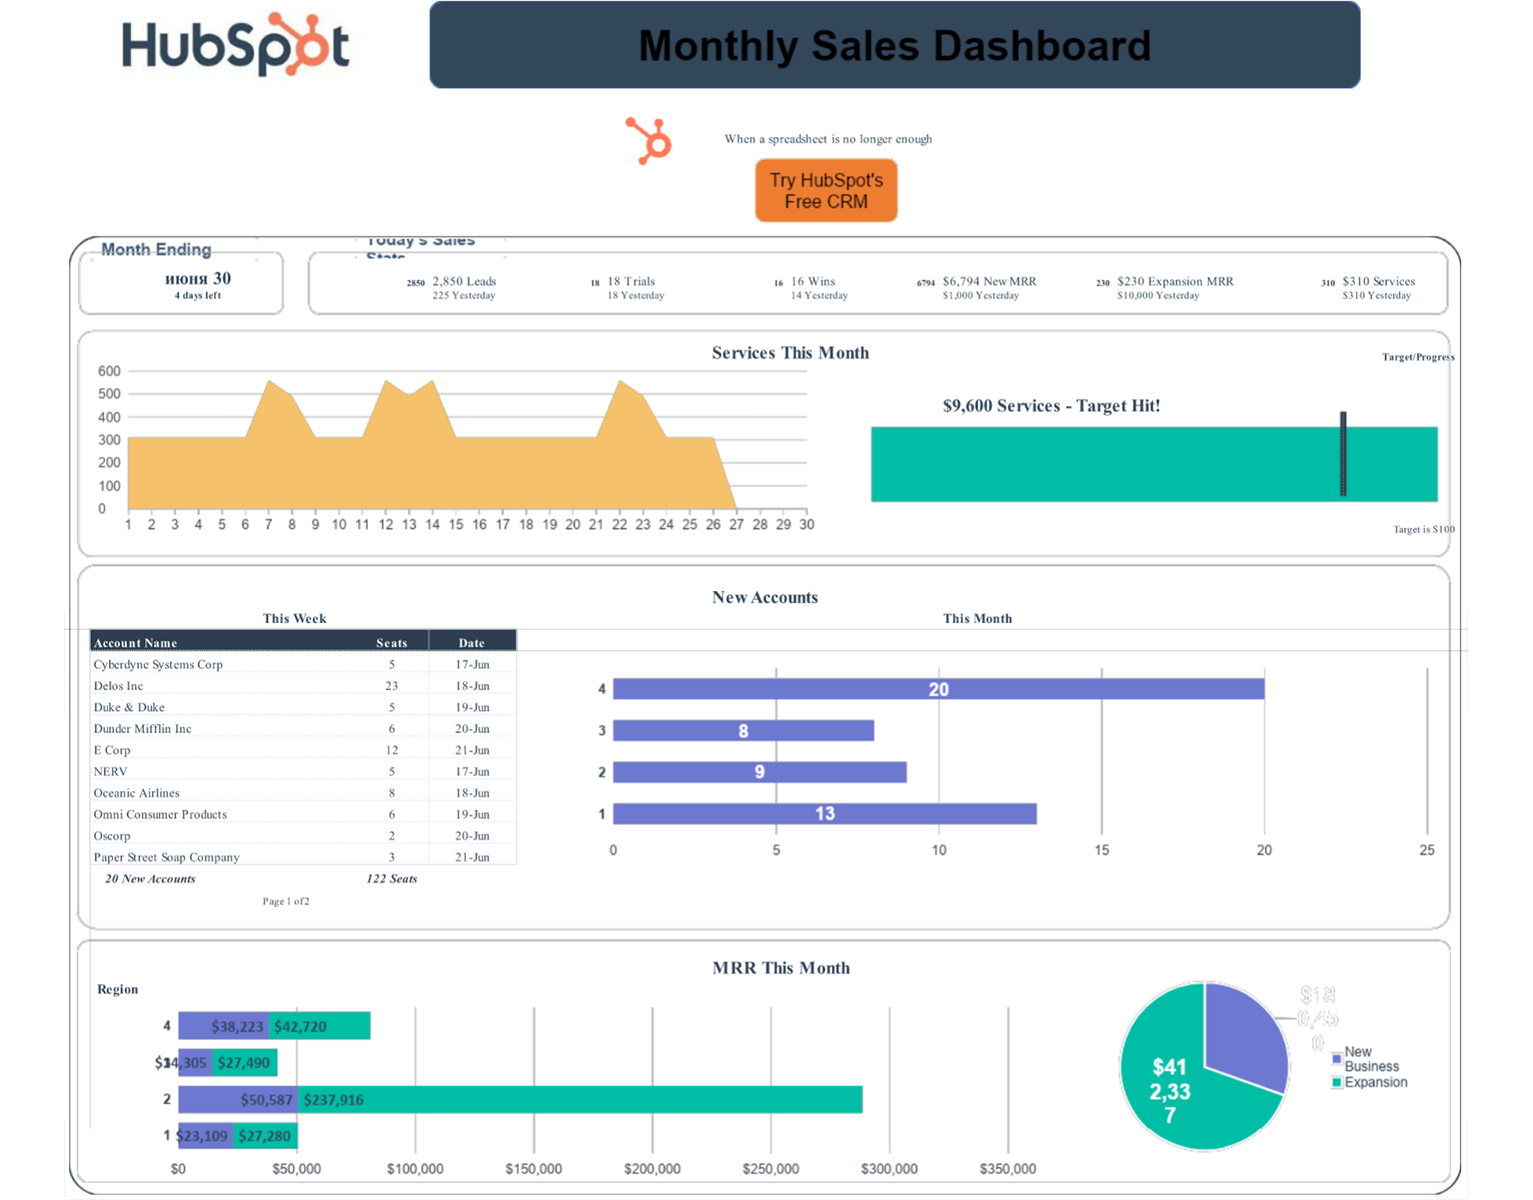
Sales Dashboard Template - Excel, Google Sheets

A sales dashboard visualizes your key sales metrics—pipeline value, win rates, revenue, and activity—in one place, helping sales teams track performance and hit targets faster. Use this free template to learn which metrics drive results before automating with real-time sales software.

Join thousands of professionals using this template.

Benefits of a sales dashboard template

A sales dashboard provides a quick overview of your organization’s sales activities. As a result, a sales dashboard template offers the following benefits for a business:

Data insights

By inserting data into a sales KPI template for Excel or Google Sheets, you can get real-time visibility into your sales performance. You can instantly view key information, such as leads, trials, and conversions.

Pattern tracking

A sales dashboard template often includes graphs to help managers identify trends and patterns over time. As a result, you can better read market changes, user preferences, and sales cycles and adjust your strategies on the go.

Easier collaboration

You can use a cloud-based sales dashboard template – like HubSpot’s template via Google Sheets – to centralize your sales data and share performance information across teams and departments. This encourages transparency, collaboration, and alignment throughout your organization.

This free sales dashboard is designed for sales teams learning performance tracking or testing which metrics move the needle. Use it when you're:

  • managing a team of 1-10 sales reps. The template works well for small to mid-size sales teams. Larger teams (15+ reps) need automated software with role-based dashboards and real-time updates.
  • updating weekly or monthly. Manual updates are manageable when done weekly (1-2 hours). If you need daily pipeline visibility, that's a signal you're ready for automated dashboards.
  • still figuring out which sales metrics matter most. Use the first 2-6 months to experiment. Many sales managers discover that half their initial metrics don't actually predict revenue.
  • have a simple sales process with 3-5 deal stages. The template handles straightforward pipelines well. Complex multi-stage enterprise sales processes need dedicated sales software.
  • want to avoid expensive sales analytics tools while bootstrapping. Free is perfect while proving your sales model, before justifying $50-200/month per rep on sales software.

While a sales dashboard template offers a great head start for your business, you’ll need to customize it to address your specific needs.

  1. List key metrics: Identify the most important sales metrics for your business. This may include the conversion rate, average order value, monthly recurring revenue, and customer acquisition cost.
  2. Rearrange dashboard elements: Organize the dashboard to show the most critical information promptly. Plus, group related metrics together for easy comparison and analysis.
  3. Configure filters: Add interactive features, such as filters, slicers, and drill-down options, to let users dig deeper into the data.

After customizing the template, you can populate it with your data to get sales insights. That said, to get the most benefits, consider the following best practices:

  • Keep it simple: Avoid cluttering the sales dashboard with all the visuals you can make. Instead, display the most relevant, actionable information.
  • Set thresholds: Define thresholds to notify stakeholders when a particular metric exceeds or falls below a predefined limit. 
  • Set thresholds: Define thresholds to notify stakeholders when a particular metric exceeds or falls below a predefined limit. 

Frequently Asked Questions

A sales dashboard is a tool that helps to visualize your sales data. They offer convenient snapshots of key sales objectives and metrics to help you track your team's performance with more accuracy and precision. And better tracking means a more efficient team, which means more closed deals and a boost in revenue!

The most crucial metrics will vary from business to business. Still, you should include sales performance, pipeline, lead generation, and customer KPIs. Finally, you should use those metrics to create visuals to show patterns, trends, and comparisons.

Start by downloading our sales dashboard template as an Excel workbook. You'll find clear instructions, simple data entry requirements, and innovative visuals to make your sales team more effective and efficient.

A sales region dashboard provides insights and analytics across different geographical regions. It helps sales managers visualize how sales spread across various regions. This allows them to identify geographical trends and make data-driven decisions to optimize their strategies.

Yes, HubSpot’s sales dashboard template for Excel is completely free.

See other Business Templates

Get the template for free!