Benefits of a sales dashboard template
A sales dashboard provides a quick overview of your organization’s sales activities. As a result, a sales dashboard template offers the following benefits for a business:
Data insights
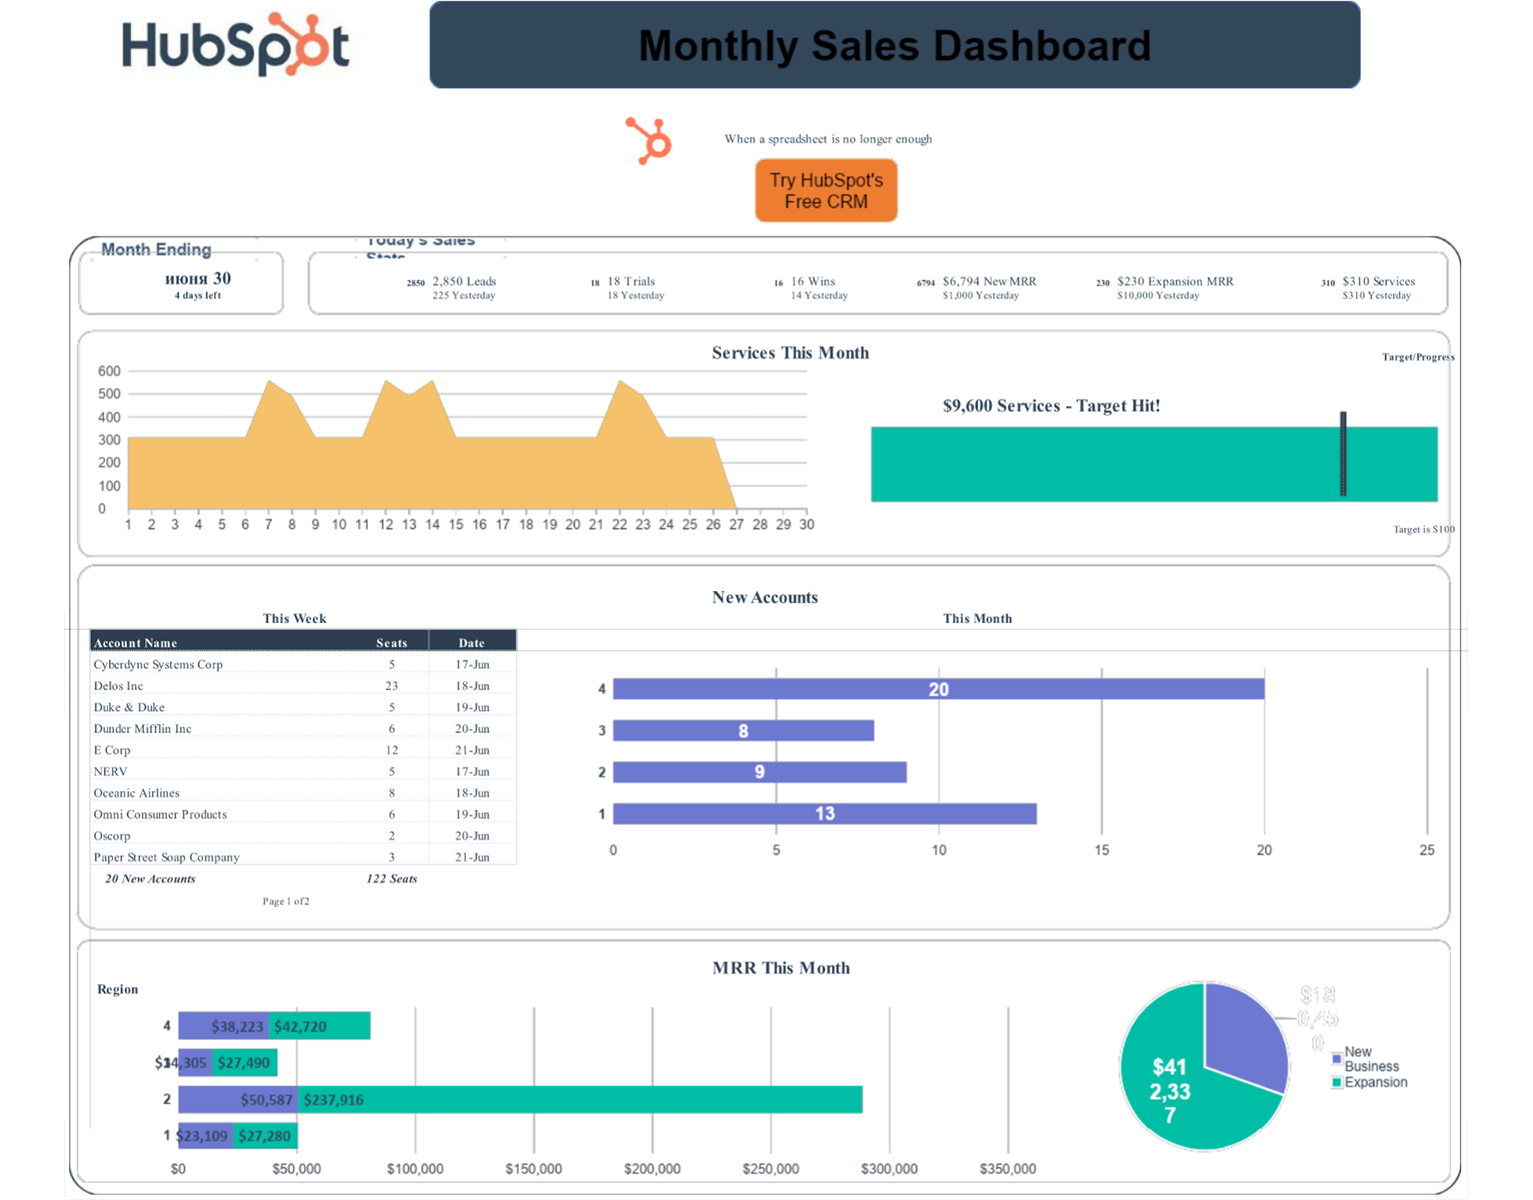
By inserting data into a sales KPI template for Excel or Google Sheets, you can get real-time visibility into your sales performance. You can instantly view key information, such as leads, trials, and conversions.
Pattern tracking
A sales dashboard template often includes graphs to help managers identify trends and patterns over time. As a result, you can better read market changes, user preferences, and sales cycles and adjust your strategies on the go.
Easier collaboration
You can use a cloud-based sales dashboard template – like HubSpot’s template via Google Sheets – to centralize your sales data and share performance information across teams and departments. This encourages transparency, collaboration, and alignment throughout your organization.
How to customize a sales dashboard template for your business
While a sales dashboard template offers a great head start for your business, you’ll need to customize it to address your specific needs.
- List key metrics: Identify the most important sales metrics for your business. This may include the conversion rate, average order value, monthly recurring revenue, and customer acquisition cost.
- Rearrange dashboard elements: Organize the dashboard to show the most critical information promptly. Plus, group related metrics together for easy comparison and analysis.
- Configure filters: Add interactive features, such as filters, slicers, and drill-down options, to let users dig deeper into the data.
Tips for using sales dashboards
After customizing the template, you can populate it with your data to get sales insights. That said, to get the most benefits, consider the following best practices:
- Keep it simple: Avoid cluttering the sales dashboard with all the visuals you can make. Instead, display the most relevant, actionable information.
- Set thresholds: Define thresholds to notify stakeholders when a particular metric exceeds or falls below a predefined limit.
- Set thresholds: Define thresholds to notify stakeholders when a particular metric exceeds or falls below a predefined limit.