• HubSpot Logo

Sales Dashboard Template for Excel & Google Sheets

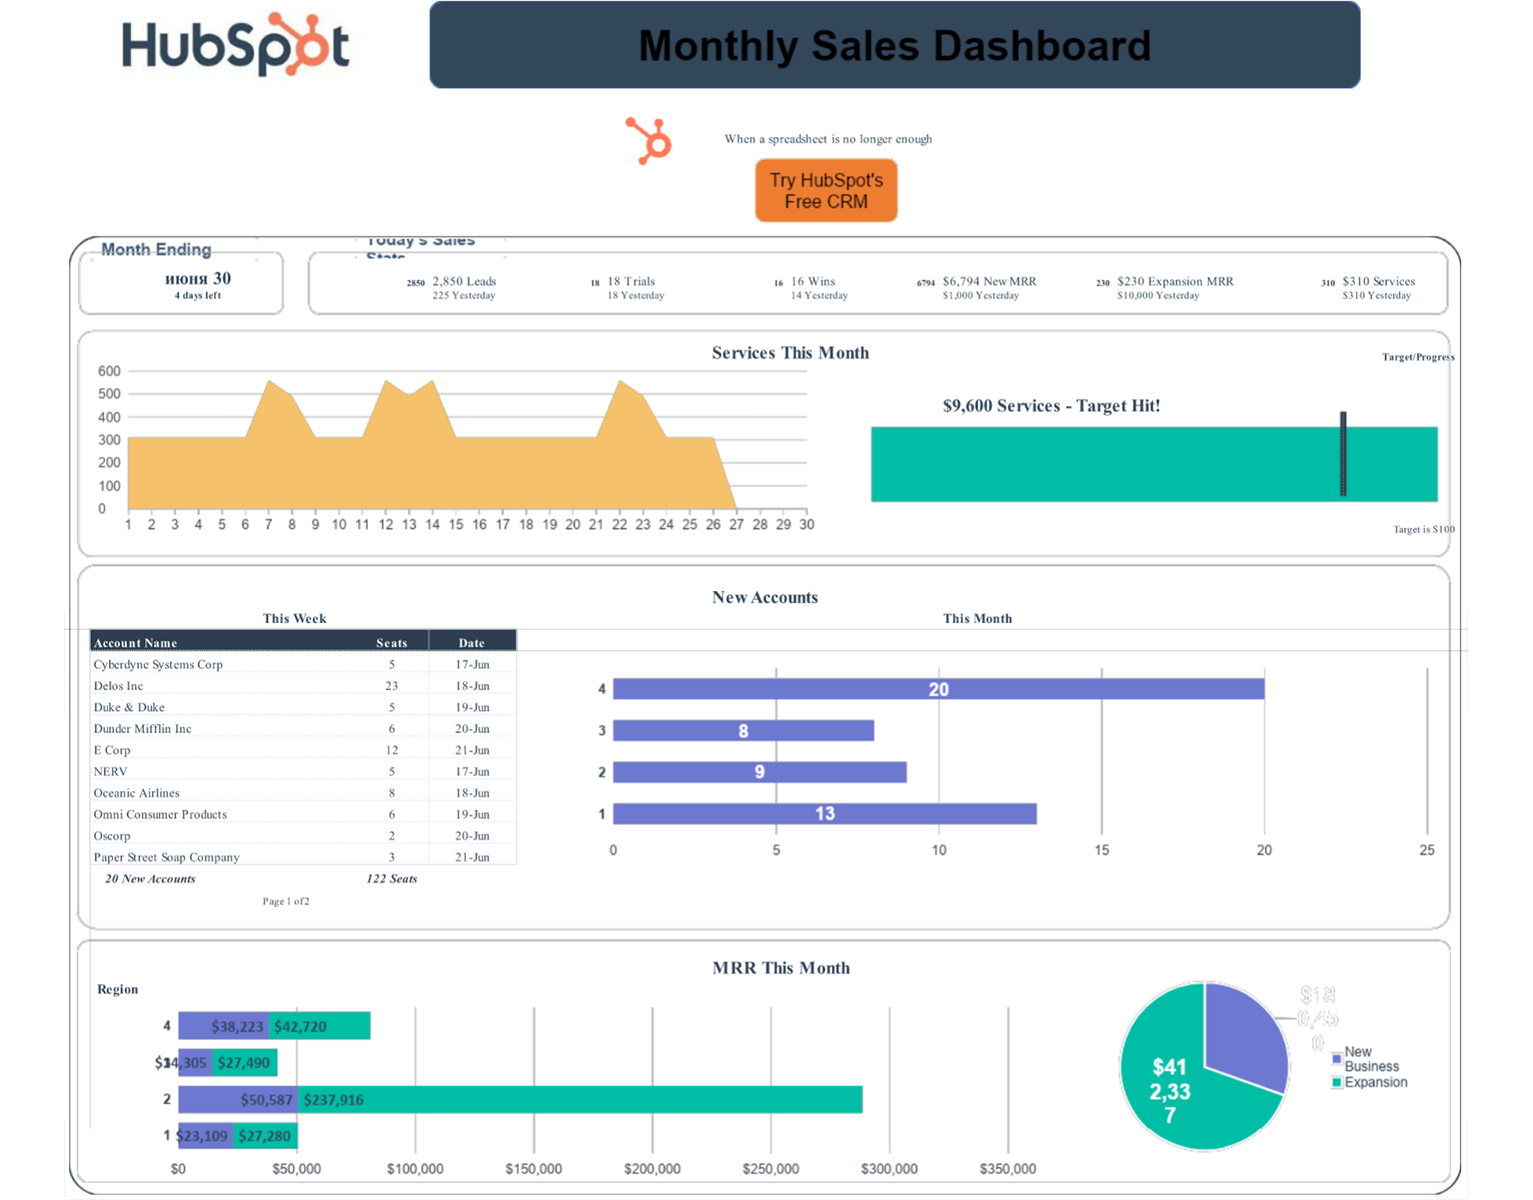
A sales dashboard template gives your entire team a single, real-time view of the metrics that drive revenue — pipeline value, win rate, deal velocity, and rep activity. HubSpot's template for Excel and Google Sheets features charts that update automatically as you enter data.

Completely free; no software subscription or credit card required!

Join thousands of professionals using this template.

How to Set Up Your Sales Dashboard Template

Follow these steps to set up your Sales Dashboard Template. Estimated setup time is only 15 minutes for a team of 1-5 reps with an existing deal list: 

Step 1: Download the template

Choose Excel (.xls) for offline use or open in Google Sheets for real-time team collaboration.

Step 2: Enter your deal stages

Replace the default pipeline stages with your actual sales process (e.g., Prospecting → Discovery → Proposal → Negotiation → Closed).

Step 3: Input your metrics

Add your team's data to the input tabs. Charts and KPI cards update automatically.

Step 4: Customize your KPIs

Add or remove metrics based on what your business actually measures — conversion rate, average order value, MRR, customer acquisition cost, or custom activity metrics.

Sales Template Dashboard Tips & Best Practices

Get the most out of HubSpot's free sales dashboard template with these best practices: 

Tips for Getting More From Your Sales KPI Template

  • Track fewer metrics, not more: Most sales teams discover that 4–5 KPIs predict 80% of revenue outcomes. Start with win rate, pipeline value, average deal size, and sales cycle length.
  • Set alert thresholds: Highlight cells in red when win rate drops below 20% or pipeline coverage falls below 3x quota. Visual cues surface problems before they compound.
  • Review weekly, not monthly: A sales metrics dashboard only creates value if reviewed consistently. Build a standing 30-minute weekly review into your team rhythm.
  • Export for stakeholder reports: Use the Excel version to snapshot monthly performance and share clean, formatted reports with leadership.

Who This Sales Dashboard Template Is Built For

This free sales dashboard template works best for:

  • Sales managers running teams of 1–10 reps who want structured performance visibility without expensive software
  • Startups and small businesses proving their sales model before investing $50–200/month per rep in a dedicated CRM
  • Sales ops professionals learning which KPIs actually predict revenue before automating reporting
  • Revenue leaders who need a fast, shareable sales report template in Excel to present to stakeholders

Not the right fit if: your team exceeds 15 reps, you need daily pipeline updates, or your sales process has more than five stages. At that point, try purpose-built software like HubSpot's Sales Hub to save more time than manual tracking costs.

When to upgrade: If your team spends more than 2 hours per week updating the spreadsheet, or if you need daily pipeline visibility, HubSpot Sales Hub automates everything this template does manually — plus adds deal scoring, email tracking, and revenue forecasting.

  Free Sales Template HubSpot Sales Hub
Cost Free Paid (with free trial)
Setup Time 15 minutes 1-3 hours
Data Entry Manual Automatic
Team Size 1-10 reps Unlimited
Real-Time Updates No Yes
CRM Integration No Native
AI Forecasting No Yes
Best For Learning, Early-stage Scaling teams


Frequently Asked Questions

A sales dashboard template is a pre-built spreadsheet that organizes your key sales metrics — pipeline, revenue, win rate, and rep activity — into charts and KPI cards that update automatically as you enter data. It replaces the need to build custom reports from scratch.

A sales KPI dashboard tracks goal-oriented metrics like win rate, quota attainment, and revenue against target. A sales performance dashboard is broader — it includes KPIs plus activity data (calls, emails, meetings) and pipeline health metrics. This template includes both.

Yes. HubSpot's template works in both Excel and Google Sheets. The Google Sheets version supports real-time collaboration, so your entire team can view and update data simultaneously.

Yes — HubSpot's Sales Dashboard Template is completely free. No email required to download, no trial period, and no paid upgrade required to use the full template.

When manual data entry takes more than 2 hours per week, or when your team needs daily visibility into pipeline changes. At that point, automated CRM dashboards will save more time than they cost. Try out HubSpot Sales Hub for 14 days for free to experience advanced, AI-powered sales automation. 

A sales funnel dashboard shows conversion rates at each stage of your pipeline — typically from lead to opportunity, opportunity to proposal, and proposal to closed-won. This template includes funnel visualization alongside KPI and activity tracking.

Yes; rename deal stages, add custom KPIs, adjust chart types, and modify input fields to match how your team actually sells. Instructions for common customizations are included in the template.

This template is optimized for teams of 1–10 reps with straightforward pipelines. Enterprise teams with complex multi-stage processes, territory hierarchies, or 15+ reps will get better results from purpose-built sales analytics software like HubSpot Sales Hub

Update your dashboard at minimum once a week. Weekly updates give you enough data to spot trends without the time cost of daily manual entry. If you find yourself needing updates more frequently than that, it's a sign you're ready for automated CRM reporting like HubSpot Sales Hub

A sales dashboard template gives managers and reps a shared, structured view of performance. Without one, sales metrics are typically scattered across multiple spreadsheets, making it hard to spot trends or course-correct before the end of a quarter. A centralized dashboard creates accountability and helps the whole team stay aligned on what's working and what isn't.

See other Business Templates

Get the template for free!