Data-backed benchmark insights for early stage B2B startups
Introduction
In today's hyper-competitive technology landscape, data-driven go-to-market teams are adapting rapidly to achieve growth milestones faster.
Startups, by nature, are pioneering new technology and pushing the status quo. In many cases, they are building their go-to-market engines from the ground up.
To manage through this environment, go-to-market leaders need competitive insights and industry-specific data to benchmark their efforts and overall progress.
HubSpot for Startups and LinkedIn Marketing for Startups are dedicated to democratizing startup resources, and that’s where this guide comes in. We’ve gathered early-stage startup data highlighting business performance metrics that startups can leverage to achieve sustained growth and efficiency:
- A brand new HubSpot & LinkedIn survey of 250 Seed to Series C B2B startup marketing leaders in the United States
- Startup-specific benchmark insights from LinkedIn’s extensive professional network
- The latest early-stage startup stats from PitchBook’s comprehensive database
We want to share what great looks like, so we’ve included breakdowns and highlighted top performers. Whether you’re approaching your Seed round or working towards your Series C, this guide will help you benchmark your growth, impress investors, and reach your next milestone.
We’re committed to leveling the playing field for startups of all sizes. Our respective organizations provide startups with resources for different stages in their journey, exclusive access to investors and funding opportunities, and an active network of growth-minded peers.
The Report
The benchmarks in the report are intended to be directional and a starting point for discussion. All startups are unique, with business and marketing metrics influenced by many variables, including investment stage, ICP, sales alignment, average deal size, nurture strategies, etc. But even with those variables, the following benchmarks should help startups understand where they stack up.
Business Metrics
Business Metric Benchmarks
Total Customer Count, YoY Growth Rate, and Churn Rate by ARR
VCs have increased their focus on pipeline predictably & profitability. Tomasz Tunguz, venture capitalist at Theory, writes about the added layer of fundraising challenge and the metrics that matter most:
 In 2024, the Series A crunch is real. Companies that achieved the previous era’s milestone, $1M or more in ARR, face a challenging Series A market. In 18 months, the Series B will again become the hardest round to raise. The most important metric across rounds isn’t ARR but pipeline predictability. Companies with great pipeline-to-quota ratios and stable sales cycles can forecast more accurately than the rest. Consistency breeds confidence in investors in an uncertain market. That’s the scarce resource today.”
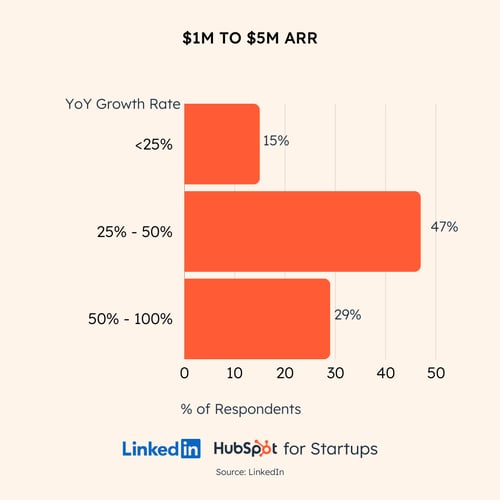
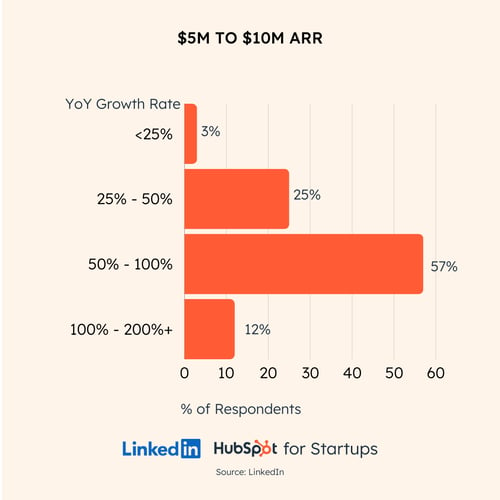
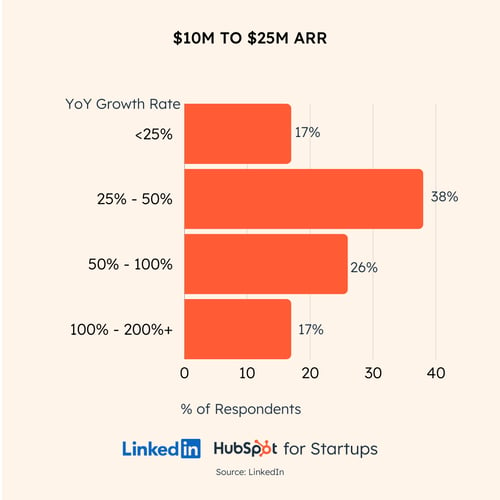
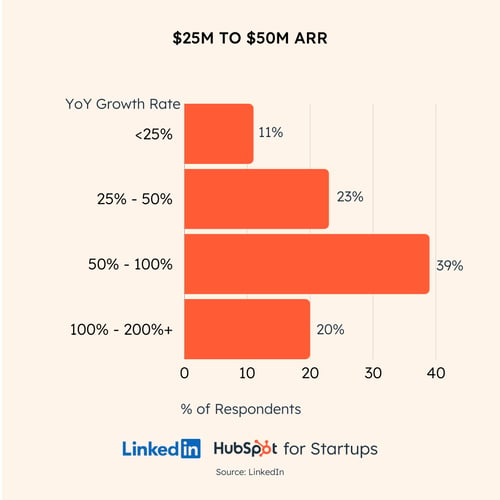
As you’ll see in this first set of charts, our survey data highlights these key data points (number of customers, YoY growth, and churn rates by ARR) while adding on the critical marketing metrics startups need to drive predictable pipeline and profitability.

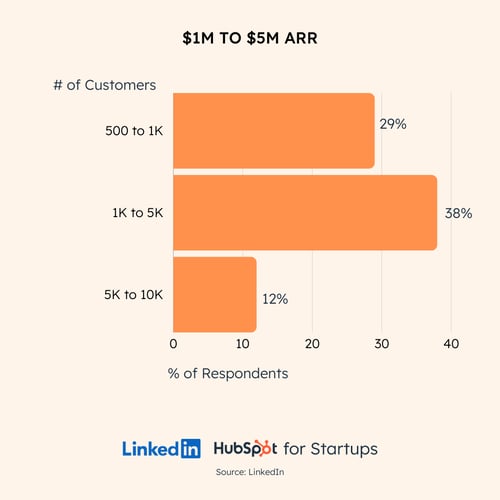
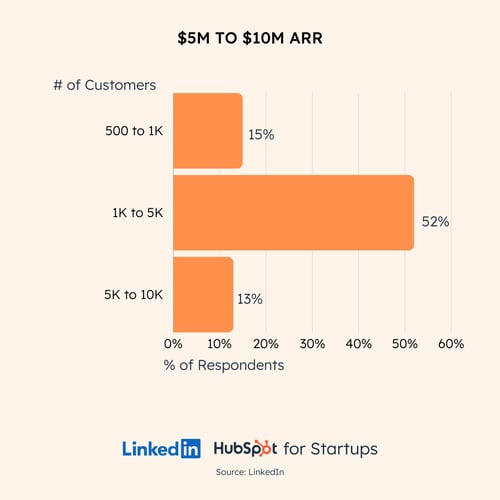
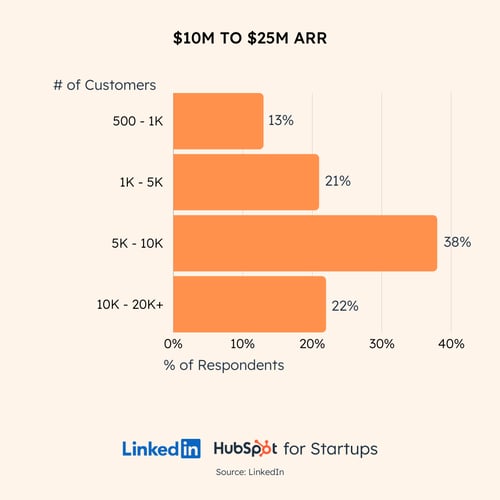
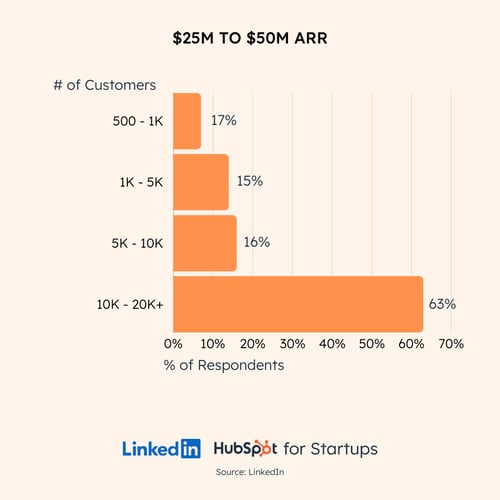
Total customer count by ARR
YoY revenue growth rate by ARR
Monthly churn rate by ARR
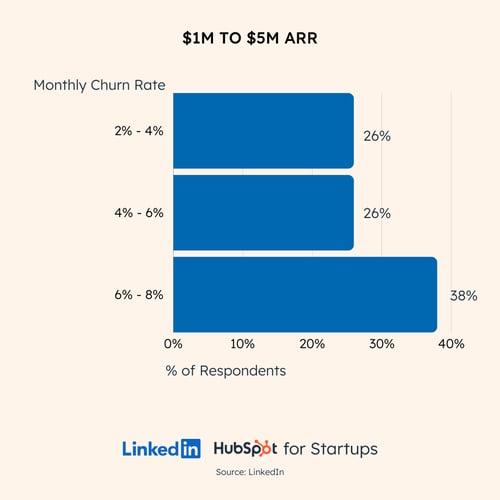
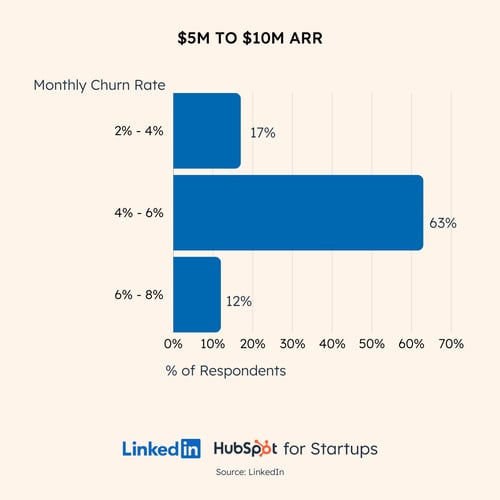
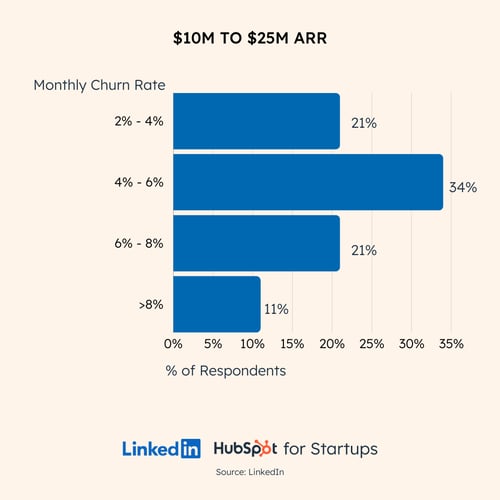
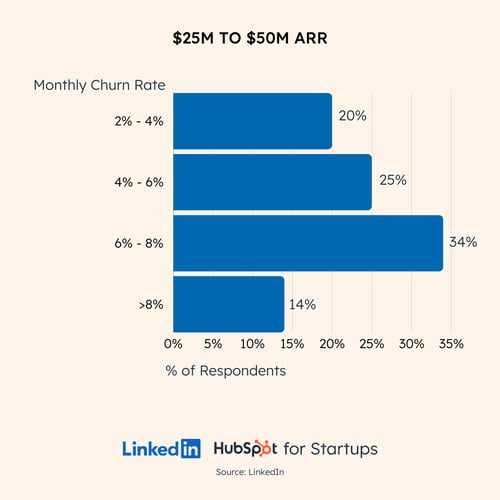
Monthly churn rate by ARR
Marketing and Sales Metrics
Marketing and Sales Metric Benchmarks
Percentage of Revenue Allocated to Marketing, Primary KPIs, Conversion Rates & Cost Pers Through The Funnel by ASP
Marketing is key to driving growth, but startup marketers often struggle to determine optimal investments, KPIs, and marketing and sales conversion health for maximum ROI. The following benchmarks will guide resource allocation and where to optimize.
Starting with the percentage of revenue invested in paid marketing efforts, the majority of B2B startups across all stages and ASPs spend on average 20 - 30% of their total annual revenue on marketing:
Percentage of Total Revenue Spent on Marketing
20%-30%

And 3 out of 4 B2B startups across all stages measure success of their marketing investments based on marketing-sourced pipeline & revenue, including demos, sales meetings, opportunities, and closed-won customers.
Top Marketing KPIs

“More and more CMOs are taking 100% ownership of qualified pipeline. In a great SaaStr panel, it was exciting to hear the Chief Market Officers at G2, New Relic, Clari, and AppFolio talk about owning the full pipeline number and doing away with the ridiculous sales vs marketing attribution battles. They talked about pipeline pacing, tight sales and marketing alignment, and the nitty gritty of the internal orchestration needed to hit meeting booking and qualified pipeline goals at the right point in the month/quarter to allow time for sales to work their magic. They talked about tracking MQLs and program performance as leading indicators, but agreed on reporting qualified pipeline through to closed won at the board level.” Kacie Jenkins, SVP of Marketing at Sendoso
Conversion Rates Through The Funnel by ASP

Lead Volume & Cost Pers Through The Funnel by ASP

Best Practices
GTM Best Practices
Intro to Best Practices
Strong sales and marketing performance can be thwarted by the reality of B2B buying cycles that are longer and harder than ever. According to Vendr’s Q2 2024 SaaS Trends Report, buying cycles for net new purchases increased 50% year over year from 32 to 48 days. A result of buyers negotiating more aggressively and proceeding into deals with caution.
Marketers know it is also more challenging than ever to get on a B2B buyer’s evaluation shortlist. According to LinkedIn’s 2024 SaaS Buyer Survey, now only 3 vendors make it onto a B2B buyers’ shortlist for evaluation, down from 6 providers 3 years ago.
We’ve highlighted how the most successful startups – those with the highest year-over-year growth, conversion rates, and funnel efficiencies— have elevated their go-to-market execution to overcome challenges and thrive in today’s tough buying environment. Their 5 best practices include:
1. ICP Diversification
Startups across all stages use LinkedIn to target prospects across SMB, Mid-Market, and Enterprise segments, typically engaging at least two segments to boost pipeline coverage and predictability, and allocating almost half of their impression share to companies with 1,000+ employees to target deals with higher annual contract values.
Targeted Audience by Company Size

2. Full Funnel Messaging
Startup marketers are often battling limited brand awareness and indecisive buyers. Buyers report an increased fear of messing up, which is now the #1 driver of customer indecision, affecting 40-60% of all sales deals, according to the Jolt Effect. We also know that only 5% of buyers are in-market at any given time—and even fewer during an economic downturn.
So, how can startup marketers think about building a pipeline and winning increasingly competitive deals?
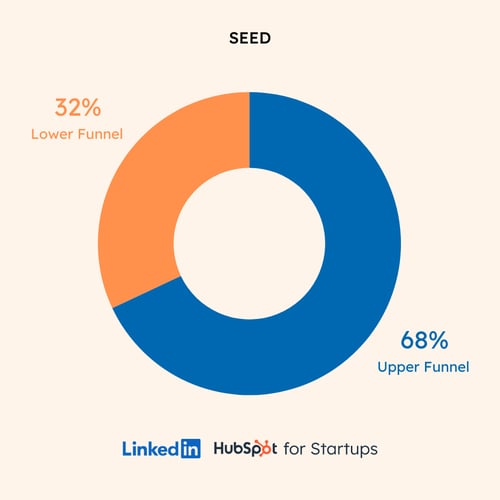
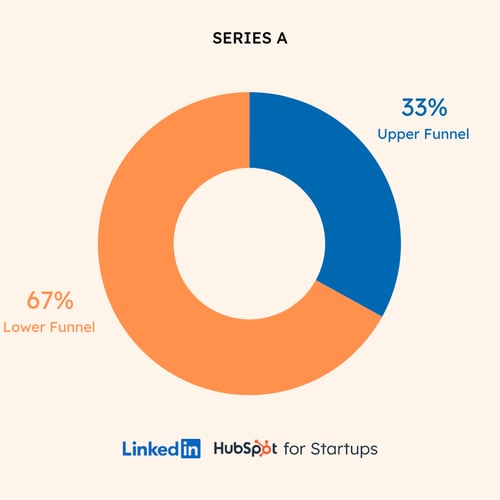
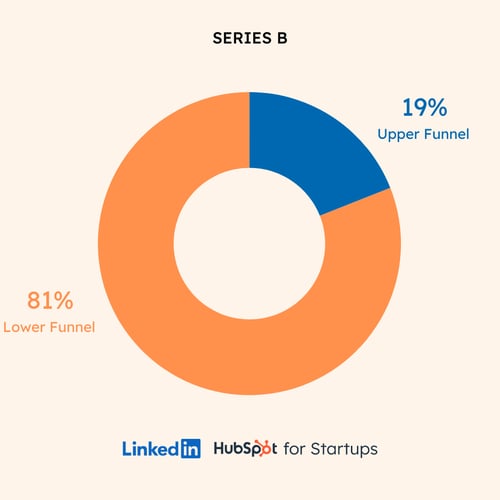
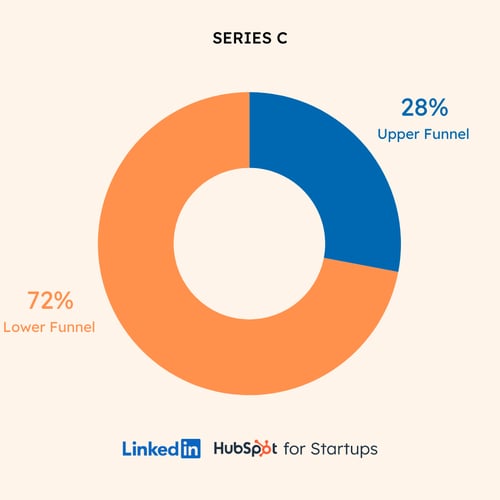
Looking at trends in startups’ investment allocation across LinkedIn campaign objectives the answer is clear: A healthy balance between upper-funnel brand awareness and lower-funnel demand capture. LinkedIn's data reveals that earlier-stage startups prioritize upper-funnel brand awareness tactics, like sharing ungated content to educate B2B buyers and fuel retargeting audiences. Then, as they mature in stage, later-stage companies prioritize larger allocations towards lower-funnel strategies, like lead generation with high-value gated content and request demo/talk to sales messaging.
Percentage of Marketing Investment By Funnel Stage
Startups should run always-on full-funnel strategies, to create and capture demand. According to LinkedIn's benchmark data, startups active with full-funnel strategies achieve 6x higher conversion rates and convert leads to sales meetings 2x faster, reducing from 46 days to 25 days from initial ad impression, compared to startups relying solely on bottom-funnel tactics.
Startups Active With Full Funnel Strategies on LinkedIn Achieve:
|
6x |
2x |
|
Higher Lead Conversion Rate |
Faster Readiness to Talk to Sales |
"Our recent LinkedIn B2B marketing efforts have yielded significant success across the entire marketing funnel. By effectively targeting the right audience at the top of the funnel (TOFU), nurturing qualified leads in the middle of the funnel (MOFU), and optimizing conversion actions at the bottom of the funnel (BOFU), we have observed substantial advancements. This success was only possible through our LinkedIn partnership, which provided us with crucial data about the influence of all our marketing materials across the funnel. Proving the influence of TOFU on BOFU has been the biggest unlock for our team to pull the levers in the right areas when optimizing, and this was achieved through the data and insights provided by LinkedIn. With their support, we had our best quarter yet.” Daniel Henderson, Head of Digital Marketing at Glean
3. Thought Leadership ↑
LinkedIn & Edelman’s 2024 B2B Thought Leadership Impact Report highlights how communicating through a trusted and credible voice is key, especially during economic downturn. 90% of B2B buyers say referrals from people they respect are most effective in earning their attention and purchase consideration, and they’re more receptive to sales and marketing outreach from a company that consistently produces high-quality thought leadership.
Our survey data validates this: 75% of startups surveyed with the highest lead-to-sales-meeting conversion rates and the highest YoY revenue growth rates cite content featuring execs and industry thought leaders as their most impactful to accelerate prospects through the buyer’s journey. The second most impactful content type is third-party reports and recognition.
Most Impactful Buyer’s Journey Acceleration Content Types

"Hockeystack tripled our revenue in H1 2024. We sourced 85% of our revenue, all inbound, from the executive thought leadership strategy we deployed on LinkedIn. This included regular posting from Hockeystack's executive team, myself included, and subject matter experts, as well as expanding our reach with industry influencers, happy customers, and tapping into LinkedIn’s Thought Leadership Ads. Every HockeyStack team member started contributing to content creation, allowing us to speak to different personas at different stages of their journey." Emir Atli, Founder & CRO at Hockeystack
4. Increased Messaging Frequency
Increasing mental availability among all category buyers, not just those in-market, with strong content types is important. And the frequency with which startups engage prospects is just as crucial, which directly impacts lead conversion rates throughout the funnel.
Startups with Strongest Lead Conversion Rates on LinkedIn Achieve
|
7-10x |
Average Frequency per Month |
And, startups across all stages and industries who achieve a 7-10x average monthly frequency on LinkedIn and are active with retargeting, achieve the following Lead Gen Form (LGF) Completion Rates by CTA and Ad Format:


"Our strategy is to be top of mind for the 95% of buyers who aren’t in market, and then be exceptional at capturing them when they are." Liam Bartholomew, VP of Marketing, Cognism
5. Tight Sales and Marketing Alignment
We’ve known for years from HubSpot’s research that companies with strong sales and marketing alignment achieve 208% more revenue from their marketing efforts. Our data shows that sales and marketing alignment has become even more of a focus amongst startups.
The most successful startups – those with the highest close rates and highest year-over-year revenue growth – cite bringing sales and marketing together more effectively as the most impactful go-to-market strategy enhancement that improved their funnel conversion rates. These companies are establishing regular weekly meeting cadences, increasing the volume of marketing touchpoints on priority target accounts and open pipelines, and optimizing sales outreach.
Improved Feedback Loops: Establish Regular Meeting Cadences
Weekly

Our data shows that performing startups are increasing the volume of marketing touchpoints across buying committees at priority target accounts and open pipelines via their Account Based Marketing (ABM) programs
Between 2022 and 2024, early-stage startups' use of ABM lists for LinkedIn ads grew by 30%. More startups across all stages prioritize ABM strategies, reinforcing the growing adoption of ABM in partnership with sales. This includes 1:many, 1:few, and 1:1 ABM and pipeline acceleration campaigns to nurture leads from initial conversion to closed-won customers.
This change is most pronounced in the Seed stage, demonstrating the need for startups to tighten sales and marketing alignment earlier than ever to successfully convert prospects through the funnel in this challenging buying environment. Now, 3 out of 4 Seed startups leverage target account lists on LinkedIn, most notably up 50% from two years ago. That number also increases as startups mature, with almost all Series A, B, and C startups leveraging target account lists as part of their strategy on LinkedIn.
Percentage of Startups with ABM List on LinkedIn

"For B2B startups, ABM is a living, breathing report card on how much awareness and integration the sales, marketing, and customer success teams have within a target account. To get ABM right, teams must align on the ICP, and the target companies, so they can offer value, credibility, and authority with their champion and across the whole buying group. One of the best channels to engage and win with your target buying committee is on LinkedIn." Aaron Cort, Head of Marketing, Growth, and GTM at Craft Ventures
Increased marketing touchpoints to sales’ target accounts are proven to positively influence sales’ effectiveness in engaging Prospects on LinkedIn with outbound outreach. LinkedIn’s Art of Winning research highlights LinkedIn members are:
|
25% |
10% |
|
More likely to respond to a LinkedIn InMail from a sales team when they are first exposed to more than 10 Sponsored Content impressions from that company. |
More likely to accept a connection request from a sales team when they are first exposed nurtured by a company on LinkedIn with marketing. |
Improved Sales Follow-Up: Optimize Sales’ Outreach to Marketing-Sourced Leads
The most successful startups also optimize the cadence and timing of sales’ marketing-sourced lead follow-up with the following best practices:

"Deepened collaboration between marketing and sales is essential. Right now, sales and marketing can’t afford to be disjointed. There is no margin for error. The strongest performing startups’ sales and marketing teams share a revenue number. That should tell us a lot: When we do this together, we’ll be more successful. And these teams look at all efforts across the customer lifecycle as a cohesive experience. It’s not marketing’s paid campaign, it’s a paid campaign that sales and marketing are doing together to ensure messaging and approach is tightly aligned.If a lead converted on a gated piece of content or engaged with your LinkedIn content, sales must leverage that as a signal because it shows their current mindset and what they care about.” Craig Rosenberg, Chief Platform Officer at Scale Ventures
Survey Audience + Methodology
