
What Is A Gantt Chart And How To Use It
Gantt charts are widely used in project management to track the progression of tasks within a larger project, visually represented through bar charts.

Gantt charts are a commonly used project management tool that shows the progression of tasks within a set deadline. Although there are alternative project management tools for planning and scheduling, the Gantt chart gained popularity in the field due to its ability to represent information clearly, visually, and comprehensively.
 Sample Gantt (CC BY-SA by Vheilman)
Gantt charts can effectively summarize the key elements of a project and depict a clear and easy-to-understand view of tasks and overall project progress. Gantt charts facilitate project monitoring and allow project management teams to allocate resources better and set priorities.
The Gantt chart was invented in the mid-1980s by the Polish engineer Karol Adamiecki. But it was Henry Gantt, an American engineer and project management consultant, who popularized it in the 1910s.
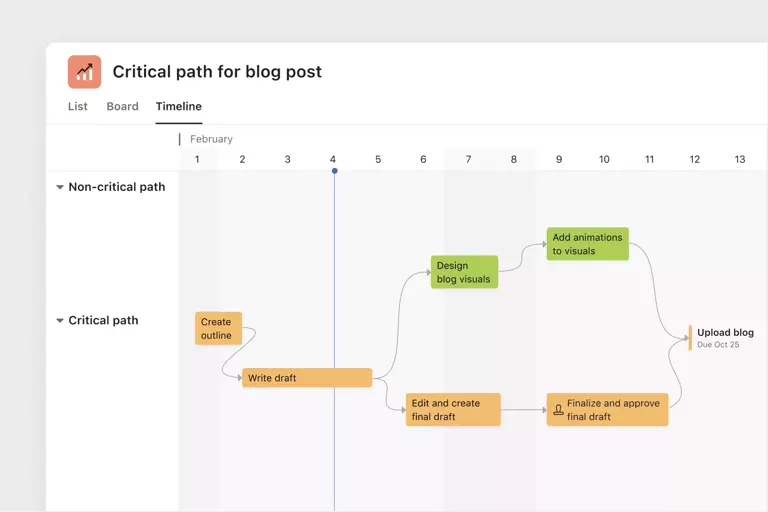
The Gantt chart is a bar chart that shows the beginning and end dates of different project tasks. It is commonly used to visualize a project schedule and depicts various aspects of the project, such as planning, task dependencies, and resource allocation.
Gantt Charts have horizontal bars that vary in length, with each bar representing the project timeline. These bars may include details such as task duration, sequences, beginning and end dates, and so on.
The lengths of these bars correspond to the time required to complete specific tasks, which are represented along the chart's vertical axis. As such, Gantt charts help project managers properly monitor and report project status and completion rate within a project.
Gantt charts used to be drawn manually on paper, with each change in the project necessitating succeeding revisions and rewrites. Today, Gantt charts are still a preferred method of tracking project schedules, but now, we have dedicated software and project management tools with digital Gantt chart capabilities.
A Gantt chart has several different components, which may vary depending on project complexity and depth. However, the key components that most Gantt charts have include the following:
Tasks or Activities run vertically down the left side of the chart and describe the work that needs to be done within a project. These may be further divided into sub-tasks, especially in larger projects.

Running horizontally on the topmost portion of the Gantt chart, the timeline or schedule can show years, months, weeks, or days. The timeline's purpose is to provide an overview of when the project will begin and end and the target completion date for each task.
These appear as light gray vertical lines on the Gantt Chart and depict the connections between tasks. Dependencies illustrate the order in which tasks should happen and help project managers effectively manage allotted time. The four types of dependencies are:
One of the most crucial Gantt chart components, progress tracking shows how much of a task has already been accomplished and is typically represented via a percentage value or bar shading. Progress tracking may also be monitored by tracking milestones and dependencies, among others, depending on the software used.
There are several ways to create a Gantt chart. You can use dedicated software, a project management tool, or simply a spreadsheet. Of course, it’s easiest to use project scheduling tools with built-in functionalities for Gantt charts, as you can easily link tasks and dependencies.
However, here are some general tips on creating an effective Gantt chart, regardless of the platform you choose:
There are several ways to maximize a Gantt chart for project scheduling:
Reviewing your chart regularly and updating it as things change is essential. A minimum revision of once per week is advisable so that it remains accurate and effective. Doing so will help to track any changes and delays and make the necessary adjustments to the project timeline.
Gantt charts, by nature, allow multiple team members to collaborate on a single chart. Don’t forget to share the chart with team members and stakeholders, as reviewing it will enable them to stay updated on project progress—resulting in better communication and increased productivity.
Gantt charts are primarily used to track progress, as they visually represent the amount of work that has already been completed and the required duration for each task. Thus, you can easily identify the asks that are lagging or those that may need to be rescheduled or focused on.
Gantt charts also allow project managers to adapt to changes by helping to identify potential issues and areas of conflict. This makes adjusting schedules and reallocating your resources easier, especially if managing multiple projects simultaneously.
Because Gantt charts are visual tools, colors can also be used strategically to serve as differentiators between different tasks, team members, or projects. This adds an extra layer of organization and context to a chart, making it easier to read and understand related tasks and overlaps.

Image CC BY-SA Harry Truinkers
While Gantt charts serve as a comprehensive view of project tasks, it’s important to stick only to the essential details and tasks crucial to the project. Otherwise, an overloaded Gantt chart may become a source of confusion rather than clarity.
As mentioned earlier, there are several options for creating Gantt charts.
Project management tools like Trello, Asana, and Monday, typically have Gantt chart functionalities or similar features. Monday, for example, has customizable Gantt charts that project managers can use to visualize their project timelines, complete with color coding, dependencies, adjustable timelines, and more.
Asana also has a Gantt feature alongside its Timeline functionality, so project managers can map out project plans that are shareable and accessible in real-time. Asana also allows you to directly import your CSV file and translate it into an actionable Timeline.
The upside of using project management software is that you’ll have access to a wider range of project management features that you can use to optimize your workflows. The downside, however, is that teams will usually have to pay a subscription fee to use these tools and unlock all of their functionalities.
There are also some dedicated standalone tools for creating Gantt charts, like Team Gantt, Instagantt, and Gantt Pro. Instagantt, for example, presents a simplified user experience through a drag-and-drop function that allows users to schedule tasks in seconds. There are also a lot of features specific to Gantt charts, like subtasks, milestones, dependencies, and email notifications to update team members on recent changes.
Team Gantt also has a drag-and-drop function that makes creating and updating Gantt charts easier. It also includes basic Gantt functionalities like tasks, timelines, and assignments. The main advantage of using dedicated Gantt software is that it does away with the complexity of using other tools, especially if you mostly just use the Gantt function anyway.
You’ll also get to customize and detail your Gantt charts, as the tools are typically intuitive and feature-rich. The main downside is that these tools are also subscription-based, with price points equivalent to (and some higher than) project management tools.
Spreadsheets are old-school but can still be useful in creating Gantt charts. They provide a cost-effective alternative to paid tools and can be a viable option for teams with a tight budget or smaller projects.
Google Sheets provides a collaborative, easy-to-update platform for creating Gantt charts, while Microsoft Excel allows for a straightforward, virtually free way to create and update Gantt charts. You can also use several spreadsheet templates to create Gantt charts, such as these Excel templates from Microsoft and this Google Sheet template.
Project managers for startups will find Gantt charts an invaluable tool for planning a variety of projects related to engineering, design, or production. There are nearly four dozen project management tools on the HubSpot Marketplace, many of which have Gantt or Gantt-like features. (Read abot the top five).
Ready to level up your productivity? With HubSpot for Startups and Asana for Startups, you can optimize your workday like never before. As a member of the HubSpot for Startup community, you'll receive 12 months free of Asana’s Business plan. Take advantage of this amazing offer by joining the HubSpot for Startups program today.