How To Create Startup Financial Projections [+Template]


Businesses run on revenue, and accurate startup financial projections are a vital tool that allows you to make major business decisions with confidence. Financial projections break down your estimated sales, expenses, profit, and cash flow to create a vision of your potential future.
In addition to decision-making, projections are huge for validating your business to investors or partners who can aid your growth. If you haven’t already created a financial statement, the metrics in this template can help you craft one to secure lenders.
Whether your startup is in the seed stage or you want to go public in the next few years, this financial projection template for startups can show you the best new opportunities for your business’s development.
In this article:
A financial projection uses existing revenue and expense data to estimate future cash flow in and out of the business with a month-to-month breakdown.
These financial forecasts allow businesses to establish internal goals and processes considering seasonality, industry trends, and financial history. These projections cover three to five years of cash flow and are valuable for making and supporting financial decisions.
Financial projections can also be used to validate the business’s expected growth and returns to entice investors. Though a financial statement is a better fit for most lenders, many actuals used to validate your forecast are applied to both documents.
Projections are great for determining how financially stable your business will be in the coming years, but they’re not 100% accurate. There are several variables that can impact your revenue performance, while financial projections identify these specific considerations:
To help manage unforeseeable risks and variables that could impact financial projections, you should review and update your report regularly — not just once a year.

Financial projections consider a range of internal revenue and expense data to estimate sales volumes, profit, costs, and a variety of financial ratios. All of this information is typically broken into two sections:
Financial projections also use existing financial statements to support your estimated forecasts, including:
Gathering your business’s financial data and statements is one of the first steps to preparing your complete financial projection. Next, you’ll import that information into your financial projection document or template.
This foundation will help you build the rest of your forecast, which includes:
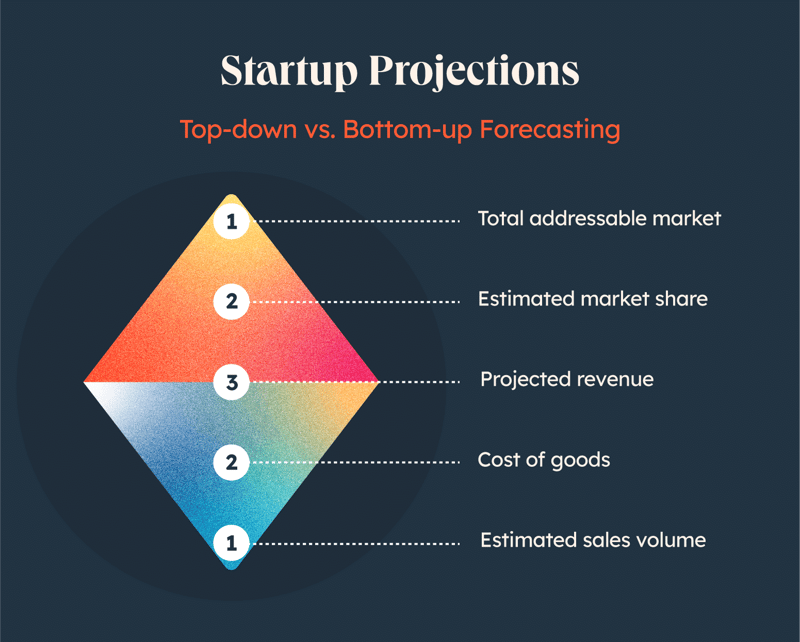
Once all of your data is gathered, you can organize your insights via a top-down or bottom-up forecasting methods.
The top-down approach begins with an overview of your market, then works into the details of your specific revenue. This can be especially valuable if you have a lot of industry data, or you’re a startup that doesn’t have existing sales to build from. However, this relies on a lot of averages and trends will be generalized.
Bottom-up forecasting begins with the details of your business and assumptions like your estimated sales and unit prices. You then use that foundation to determine your projected revenue. This process focuses on your business’s details across departments for more accurate reporting. However, mistakes early in forecasting can compound as you “build up.”

If your startup is still in the seed stage or expected to grow significantly in the next few quarters, you’ll need to account for these additional expenses that companies beyond the expansion phase may not have to consider.
Depending on your startup stage, typical costs may include:
Many of these costs also fall under operating expenses, though as a startup, items like your office space lease may have additional costs to consider, like a down payment or renovation labor and materials.
Sales forecasts can be created using a number of different forecasting methods designed to determine how much an individual, team, or company will sell in a given amount of time.
This data is similar to your financial projections in that it helps your organization set targets, make informed business decisions, and identify new opportunities. A sales forecast report is just much more niche, using industry knowledge and historical sales data to determine your future sales. Gather data to include:
Sales forecasts should consider interdepartmental trends and data, too. In addition to your sales process and historical details, connect with other teams to apply insights from:
Your sales strategy and forecasts are directly tied to your financial success, so an accurate sales forecast is essential to creating an effective financial projection.
Whereas the costs of goods solds (aka Cost of Sales or COGS) account for variable costs associated with producing the products or services you produce, operating expenses are the additional costs of running your startup, including everything from payroll and office rent to sales and marketing expenses.
In addition to these fixed costs, you’ll need to anticipate one-time costs, like replacing broken machinery or holiday bonuses. If you’ve been in business for a few years, you can take a look at previous years’ expenses to see what one-time costs you ran into, or estimate a percentage of your total expenses that contributed to variable costs.
Cash flow statements (CFS) compare a business’s incoming cash totals, including investments and operating profit, to their expected expenses, including operational costs and debt payments.
Cash flow shows a company’s overall money management and is one of three major financial statements, next to balance sheets and income statements. It can be calculated using one of two methods:
Businesses can use either method to determine cash flow, though presentation differs slightly. Typically, indirect cash flow methods are preferred by accountants who largely use accrual accounting methods.

Your income statement projection utilizes your sales forecasts, estimated expenses, and existing income statements to calculate an expected net income for the future.
In addition to the hard numbers available, you should apply your industry expertise to consider new opportunities for your business to grow. If you’re entering Series C, you should anticipate the extra investments and big returns that you’re aiming to experience this round.
Once you’ve collected your insights, use your existing income statement to track your estimated revenue and expenses. Total each and subtract the expenses from the revenue projections to determine your projected income for the period.

Your balance sheet is the final of the big three financial documents needed to establish your company’s financial standing. The balance sheet makes a case for your company’s financial health and future net worth using these details:
This document breaks down the company’s owned assets vs. debt items. It most directly tracks earnings and spendings, and it also doubles as an actual to establish profitability for prospective investors.
Launching a startup or new product line requires a significant amount of capital upfront. But at some point, your new endeavor will generate a profit. A break-even analysis identifies the moment that your profit equals the exact amount of your initial investment, meaning you’ve broken even on the launch and you haven’t lost or gained money.
A break-even point (BEP) should be identified before launching your business to determine its viability. The higher your BEP, the more seed money you’ll need or the longer it will be until operations are self-sufficient.
Of course, you can also increase prices or reduce your production costs to lower the BEP.
As your business matures, you can use the BEP to weigh risks with your product decisions, like implementing a new product or removing an existing item from the mix.
Financial ratios are common metrics that lenders use to check financial health using data from your financial statements. There are five core groups of financial ratios used to evaluate businesses, as well as an example of each:
Efficiency ratios: Analyze a company’s assets and liabilities to determine how efficiently it manages resources and its current performance.
Formula: Asset turnover ratio = net sales / average total assets
Leverage ratios: Measure a company’s debt levels compared to other financial metrics, like total assets or equity.
Formula: Debt ratio = total liabilities / total assets
Liquidity ratios: Compare a company’s liquid assets and its liabilities to lenders to determine its ability to repay debt.
Formula: Current ratio = current assets / current liabilities
Market value ratios: Determine a public company’s current stock share price.
Formula: Book value per share (BVPS) = (shareholder’s equity - preferred equity) / total outstanding shares
Profitability ratios: Utilize revenue, operating costs, equity, and other other balance sheet metrics to asses a company’s ability to generate profits.
Formula: Gross profit margin = revenue / COGS
Graphs and charts can provide visual representations of financial ratios, as well as other insights like revenue growth and cash flow. These assets provide an overview of the financial projections in one place for easy comparison and analysis.
As a startup, you have some extra considerations to apply to your financial projections. Download and customize our financial projections template for startups to begin importing your financial data and build a road map for your investments and growth.
A sound financial forecast paves the way for your next moves and reassures investors (and yourself) that your business has a bright future ahead. Use our startup financial projections template to estimate your revenue, expenses, and net income for the next three to five years.
Ready to invest in a CRM to help you increase sales and connect with your customers? HubSpot for Startups offers sales, marketing, and service software solutions that scale with your startup.
