Databox + HubSpot Integration Case Study


Revenue River is a Diamond Tiered HubSpot Agency Partner, built to market businesses online, generate qualified leads, and enable sales personnel with dynamic tools and resources. They create real results for clients by executing digital sales, marketing, and web methodologies.
HubSpot Agency Partner Revenue River Marketing had been a long-time lover of inbound marketing over traditional tactics. But when it came time to report on their clients’ results each month, consolidating and reviewing data from a multitude of client platforms proved to be a time-consuming feat. For years, the Revenue River team was spending two to three hours per client per month on reporting alone, four times what they were spending on analysis.
Reporting took a long time in part because the Revenue River team had to track many individual metrics. It was worth it for the analysis they’d be able to pass along in the end, but the team struggled to see what was really moving the needle for their clients before completing the monthly reports. Databox’s integration with HubSpot was the perfect solution for Amanda Daume of Revenue River’s team.
Databox CEO Pete Caputa built the Agency Partner Program at HubSpot before taking the helm at Databox, so he understood the challenges that reporting and analysis posed to agencies looking to accelerate their clients’ growth. Instead of copy and pasting and reformatting data from different sources like SEMrush, Google Analytics, and HubSpot, teams using Databox can see combined reports in real time to make rapid decisions.
Databox simplified Revenue River’s reporting, and integrating HubSpot data with data from other platforms they were using with the integration gave them the ability to show their clients the most important metrics on their inbound marketing efforts:

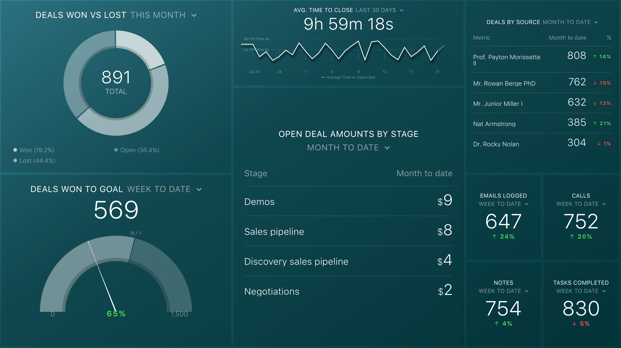
An example Databox + HubSpot dashboard (see the live template here)
Amanda Daume, Director of Sales Enablement at Revenue River, loves that her team is able to run custom calculations without extensive coding or development skills. She’s able to see crucial metrics like cost per lead and cost of customer acquisition at any time without undertaking an hours-long reporting effort.
Additionally, Databox alerts allow her team to identify both green and red flags in their clients’ HubSpot accounts - they can immediately see if a marketing tactic is doing well and congratulate their clients, or they can course-correct something that’s gone wrong before the damage is done. In looking at Databox’s default HubSpot metrics, Revenue River identified that different teams were tracking leads, qualified leads, and customers differently, causing a breakdown in marketing and sales alignment. Amanda describes the alerts as “a built-in safety net” for her inbound marketing efforts.
The Databox dashboard allows agencies like Revenue River to pull data up to two years old from a Smart List, presenting the insights in a sleek data visualization that they can analyze by time frame. With these data visualizations, Amanda and her team can configure their dashboards strategically to focus on the metrics that are really driving growth.
The team can look at stats like Deal Amount by Original Source to close the attribution loop and New Leads/Opportunities/Customers without Offline Source to better evaluate how much of an impact marketing is making on the bottom line. “Organization-wide visibility has helped ensure buy-in across teams and closed the gap in understanding how one department's efforts affect the others’,” she says.

Integrating your HubSpot and Databox platforms will allow you to easily create comprehensive dashboards that actually present a meaningful data story. No more vanity metrics, superficial insights or overly manual reporting – this powerful software combination offers exactly what you need to make your work life easier without the frustrating bells and whistles you don’t need.
Amanda Daume
Director of Sales Enablement
Revenue River
Databox has heavily emphasized building out metrics for HubSpot users. Whereas a typical automated reporting software pulls around 30 to 40 high-level metrics on HubSpot, Databox pulls 135, and they’re continuing to invest resources in the HubSpot integration to provide even deeper insights to their users.

An example Databox + HubSpot + multiple source dashboard (see the live template here)
Before installing the integration, each of Revenue River’s six marketers was spending about 10 hours per month putting together reports and only 2.5 hours analyzing those reports. Now, they’re able to spend twice as much time on analysis and 50% less time on reporting. By spending more time on analysis, they’re able to construct a story with the data, which is important to both Revenue River and their clients.
“Integrating your HubSpot and Databox platforms will allow you to easily create comprehensive dashboards that actually present a meaningful data story,” says Amanda. “No more vanity metrics, superficial insights or overly manual reporting – this powerful software combination offers exactly what you need to make your work life easier without the frustrating bells and whistles you don’t need.”
See Databox + HubSpot in Action