Logo - Full (Color)
Skip to content
 

The Ultimate List of Marketing Statistics for 2024

To be an effective marketer, you must keep up with the latest marketing statistics so you can better reach your target audience and boost conversions.

The marketing world is dynamic and ever-changing. The latest trends, technologies, and tactics are never stagnant. Keeping an eye on the newest marketing statistics is critical to stay ahead.

As the former head of marketing for two different tech companies, I’ve learned that staying on top of the latest numbers is a vital way to ensure the success of any business.

Whether you’re focused on SEO, content marketing, advertising, or marketing technology, I’ve collected the stats you need to connect with your customers, reach your target audience, and boost conversions.

Download Now: HubSpot's Annual State of Marketing Report

Search Engine Optimization Statistics

Search engine optimization, or SEO, allows you to understand and optimize how consumers find information about your brand and your competitors online. By incorporating SEO strategies in your marketing efforts, you’ll increase your website’s visibility and rankings on search engine results pages (SERPs).

The following SEO marketing statistics will help you fine-tune your SEO strategy, increase website traffic, and boost conversions.

Download Now: Free State of Marketing Report

Conversion Rate Optimization (CRO)

  • More than one in three marketing leaders cite conversion rates as a top KPI that they prioritize tracking (HubSpot State of Marketing Report, 2023).
  • Nearly two out of three marketers report that their average landing page conversion rate is less than 10% (HubSpot State of Marketing Report, 2023).
  • The average website has a bounce rate of 37% and an SEO click-through rate of 13% (HubSpot State of Marketing Report, 2023).
  • 70% of marketers believe that A/B testing is essential to boost conversion rates (ZipDo Essential A/B Testing Statistics, 2023).
  • The average conversion rate across all e-commerce sites is under 2% (Statista, 2023).
  • Conversion rates are highest for health and beauty online shopping at 2.7% and lowest for luxury handbags at just 0.4% (Statista, 2023).
  • Email marketing is one of the most effective channels for driving conversions, with a 2.8% conversion rate for B2C brands and a 2.4% conversion rate for B2Bs (FirstPageSage, 2023).

Mobile Search

  • Younger users prefer mobile search to desktop, with 80% of Gen Z and 62% of millennials reporting primarily using mobile search (HubSpot State of Marketing Report, 2023).
  • Most marketers report that mobile devices were responsible for more than half of their annual traffic (HubSpot State of Marketing Report, 2023).
  • The average U.S. household had 22 connected devices in 2022 (Deloitte, 2022).
  • Google accounts for over 95% of global mobile search market share (StatCounter, 2023).
  • Mobile advertising spending is projected to reach nearly $400 billion by 2024 (Statista, 2023).

Organic Search

Voice Search

  • 13% of marketers are leveraging voice search optimization (Alexa, Siri, etc.) as part of their marketing strategy. (HubSpot Marketing Trends Report, 2024)
  • In the U.S., 41% of adults use voice search daily (TechReport, 2023).
  • About 90% of people think voice search is easier and faster than traditional search (TechReport, 2023).
  • Over one in three Americans owns a smart speaker (Edison Research, 2023).
  • Amazon leads the smart speaker market, accounting for 67% of U.S. market share (Statista, 2023).

E-commerce

  • Smartphones account for over 70% of retail website visits worldwide (Statista, 2023).
  • E-commerce accounts for over 20% of all global retail sales (Statista, 2023).
  • Amazon is the top e-commerce platform in traffic, but Alibaba’s Taobao and Tmall lead in gross merchandise value (Statista, 2023).

graph displayed the most important metrics marketers use to assess their SEO strategy


Want to access statistics like this and more? Download our latest report

Want more data?

Download the latest report from HubSpot Research
including 70+ data points from 3,400 marketers across the globe

Content Marketing Statistics

As a marketer, I’ve found that content marketing is one of the most powerful tools in my toolbox. Creating and sharing relevant media with your target audience can help prospective customers learn about your brand, expertise, and products or services.

However, it‘s important to consider content marketing statistics to develop your brand’s best content marketing strategy. These statistics offer insight into how other content marketers solve their target audience’s pain points and generate leads, ultimately helping you determine which techniques will work best for your business, customers, and leads.

Download Now: Content Promotion Templates + Kit

Blogging

  • Blog posts are the most famous content format, with 9 out of 10 marketers using their blogs to achieve their content goals (SEMrush, 2023).
  • Companies with blogs produce an average of 67% more leads per month than companies that don’t have active blogs (DemandMetric).
  • 43% of content marketers report using AI to help them generate ideas (43%), but just 3% use it to write entire articles (Orbit Media, 2023).
  • The average blog post length is 1,427 words — more than 70% longer than ten years ago (Orbit Media, 2023).
  • Only 3% of brands regularly publish blog posts longer than 2,000 words (Orbit Media, 2023).

Video

  • Short-form video is the top leveraged media format in marketers content strategies. (HubSpot Marketing Trends Report, 2024)
  • 91% of businesses use video as a marketing tool in 2023. (Wyzowl, 2023)
  • 42% of video marketers say they spend between $0 and $500 on an average video. (Wyzowl, 2023)
  • YouTube is the most widely used video marketing platform. (Wyzowl, 2023)
  • Short-form video is the top trend marketers report leveraging in 2023 (HubSpot State of Marketing Report, 2023).
  • 8% of marketing videos average less than 10,000 views, 16% average under 1,000 views, and 16% average over 100,000 views (HubSpot State of Marketing Report, 2023).
  • 60% of video marketers list engagement rate as a top KPI, followed by conversion rate (56%) and click-through rate (52%) (HubSpot State of Marketing Report, 2023).
  • 96% of marketers agree that the optimal length of a marketing video is under 10 minutes.
  • 36% of video marketers believe that the optimal length for a marketing video is between one and three minutes, 27% say the optimal length is four to six minutes, and 15% say it’s seven to nine (HubSpot State of Marketing Report, 2023).

Content Strategy

Audio

  • 25% of marketers leverage podcasts or other audio content as part of their content strategy. (HubSpot State of Marketing Report, 2024)
  • 47% of marketers who leverage audio content and podcasts plan to invest more budget in 2024. (HubSpot State of Marketing Report, 2024)
  • Only 3% of marketers say they've used audio chat rooms like Clubhouse in their marketing role. (HubSpot State of Marketing Report, 2024)
  • Ad spending in the digital audio advertising market is projected to reach more than $10 billion in 2023 and $13 billion in 2028 (Statista, 2023).
  • More than 60% of digital audio listeners in the U.S. paid for a streaming audio subscription in 2022 (Insider Intelligence, 2023).
  • 86% of consumers recall podcast ads more than any other channel (Basis Technologies, 2023).
  • 53% of people who own a smart speaker and have heard an ad on their device say they will likely respond to it (Basis Technologies, 2023).
  • 61% of audio listeners pay attention to audio ads (compared to just 19% of TV watchers who actively watch TV ads) (Basis Technologies, 2023).
graph showing the most effective formats used in marketing strategies
Want to access statistics like this and more? Access Our Latest Research.

Social Media Statistics

With billions of people on social media globally, understanding how to market on various platforms has become integral to every business’s success.

The social media marketing statistics below will give you insight into how marketers today successfully expand their reach, boost brand awareness, and promote their products and services through these platforms — and empower you to do the same.

Download Now: Free State of Marketing Report [Updated for 2024]

Facebook

  • Facebook is the most popular social media platform marketers used in 2023, and marketers report that it has a better ROI than every other platform (HubSpot State of Marketing Report, 2023).
  • Facebook has over 3 billion monthly active users and is the most-used social network worldwide (Statista, 2023).
  • One in four marketers list Facebook as one of the most effective platforms for building community on social media (HubSpot Social Media Trends Report, 2023).

Instagram

  • Instagram has 2 billion monthly active users globally (Backlinko, 2023).
  • Instagram posts generate 23% more engagement than Facebook, even though Facebook has twice as many monthly users (HubSpot State of Marketing Report, 2023).
  • In 2023, 22% of Instagram users watched branded content Stories from a company, business, or brand more than once a week, and 36% liked, commented, or shared branded Stories (HubSpot State of Marketing Report, 2023).
  • Instagram Live has the highest ROI of any Instagram content format and is the most effective for gaining followers and shares (HubSpot State of Marketing Report, 2023).

X (formerly Twitter)

  • X has over 500 million monthly active users worldwide (Search Logistics, 2023).
  • 66% of marketers reported that they would keep their brand on X in 2023, but 71% said they spent less time working on the platform in 2023 than in previous years, and 67% planned to invest in X alternatives (HubSpot State of Marketing Report, 2023).
  • X is the 12th most popular social media platform (Statista, 2023).

LinkedIn

  • LinkedIn has over a billion members across 200 countries and regions (LinkedIn, 2023).
  • Over half of LinkedIn’s users are between 25 and 34 (Hootsuite, 2023).
  • 40% of B2B marketers list LinkedIn as the most effective channel for driving high-quality leads (Sprout Social, 2023).
  • 89% of B2B marketers use LinkedIn for lead generation, and 62% say it produces leads for them effectively (Sprout Social, 2023).

Pinterest

  • Pinterest has more than 450 million monthly active users (Pinterest, 2023).
  • 85% of Pinterest’s weekly users have purchased the platform (Pinterest, 2023).
  • Over three in four Pinterest users are women (Statista, 2023).
  • 45% of people in the U.S. with a household income of over $100,000 are on Pinterest (Hootsuite, 2023).
  • 97% of top searches on Pinterest are unbranded (Pinterest, 2023).

Snapchat

  • Snapchat has over 400 daily active users worldwide (Statista, 2023).
  • Snapchat users create over 5 billion daily snaps (Snapchat, 2023).
  • Snapchat users spend an average of 30 minutes daily on the platform (The Social Shepherd, 2023).
  • 48% of Snapchat users are aged 15-25 (The Social Shepherd, 2023).
graph displaying social media channels with the highest ROI

Social Media Management

  • 90% of social media marketers say building an active online community is crucial to a successful social media strategy (HubSpot State of Marketing Report, 2023).
  • Social media is the most preferred product discovery platform for consumers aged 18 to 44 (HubSpot State of Marketing Report, 2023).
  • 80% of social media marketers believe consumers will buy products directly in social apps more often than on brands’ websites or third-party websites like Amazon (HubSpot State of Marketing Report, 2023).
  • 66% of social media marketers report that funny content is the most effective for their brand, followed by relatable content (63%) and trendy content (59%) (HubSpot State of Marketing Report, 2023).
  • Marketers report that their biggest social media challenge is determining which platforms to invest in (HubSpot State of Marketing Report, 2023).

Visual Content

  • 26% of marketers are already using infographics while 15% plan to leverage it for the first time in 2024. (HubSpot Blog Research, 2024).
  • 21% of marketers list using visual content to boost dwell time as a top SEO marketing strategy (HubSpot State of Marketing Report, 2023).
  • Infographics are 30 times more likely to be read than a written article, and they can increase website traffic by up to 12% (DemandSage, 2023).
  • 55% of marketers create social media infographics more than any other visual media (DemandSage, 2023).
  • 43% of marketers say that creating consistently high-quality visual content is one of the biggest hurdles they face (DemandSage, 2023).

Social Media Usage

  • The number of global social media users is expected to reach 5.1 billion in 2025. (Statista, 2023)
  • TikTok is the most downloaded non-gaming app in the world with over 627 million downloads. (Business of Apps, 2023)
  • About 60% of the world’s population uses social media (DataReportal, 2023).
  • The average social media user spends 2 hours and 24 minutes on social media every day (DataReportal, 2023).
  • More than 90% of working professionals aged 16 to 24 use social media for work-related communication, while less than two-thirds of professionals aged 55 to 64 report using social media at work (DataReportal, 2023).

Looking for more insight on marketing strategies?

HubSpot asked 3,400 marketing professionals about strategy
Check out our Not Another State of Marketing report for the latest benchmark data.

Video Marketing Statistics

In today’s marketing landscape, video marketing is critical. Video can be a great way to appeal to your target audience and convert leads into customers. Plus, with the impressive video capabilities available on smartphones, video marketing is also an affordable and easy tactic to implement, no matter your business type or resources.

Below, I’ve compiled a few statistics to show how companies use this medium to reach, educate, and nurture their customers.

→ Access Now: Video Marketing Starter Pack [Free Kit]

Short-Form Video

  • 56% of marketers reported that short-form video was the top trend they planned to invest in in 2024 (HubSpot State of Marketing Report, 2024).
  • More than one in three video marketers say that the optimal video is just one to three minutes long, and 96% agree that videos should be less than 10 minutes long  (HubSpot State of Marketing Report, 2023).
  • 73% of consumers prefer to watch a short-form video to learn about a product or service (The Leap, 2023).

Product Video

Social Video

Video Analytics

  • In 2022, over 15 million video files were uploaded to Wistia. (Wistia, 2023)
  • Data shows that video engagement rate stays high at 38% for videos up to 30 minutes. For videos between 30 and 60 minutes, it drops to 26% then to 16% for videos over an hour. (Wistia, 2023)
  • 92% of video marketers reported that video gives them a positive ROI. (Wyzowl, 2023)
  • 92% of video marketers feel the levels of noise and competition have increased in the last year. (Wyzowl)
  • 99% of people who use video for marketing say they’ll continue using video. (Wyzowl, 2023)
  • People are 1.5x more likely to watch video daily on a smartphone than on a computer. (Facebook, 2020)
  • The most common types of videos made by companies are live action (66%), followed by screen recorded (57%), and animated (55%). (Wyzowl, 2023)
  • 53% of video marketers say video has reduced the number of support calls they’ve received. (Wyzowl, 2023)

YouTube

  • YouTube has more than 2.5 billion active users (DataReportal, 2023).
  • YouTube’s user base is 45.6% female and 54.4% male (DataReportal, 2023).
  • More than half of U.S. viewers agree that YouTube ads are more relevant than ads on traditional TV or other streaming apps (Google, 2023).
  • 22% of marketers have incorporated YouTube Stories into their video marketing strategy (Social Media Examiner, 2023).
  • In the United Kingdom, children spend an average of 64 minutes — more than an hour — on YouTube daily (Statista, 2022).

Email Marketing Statistics

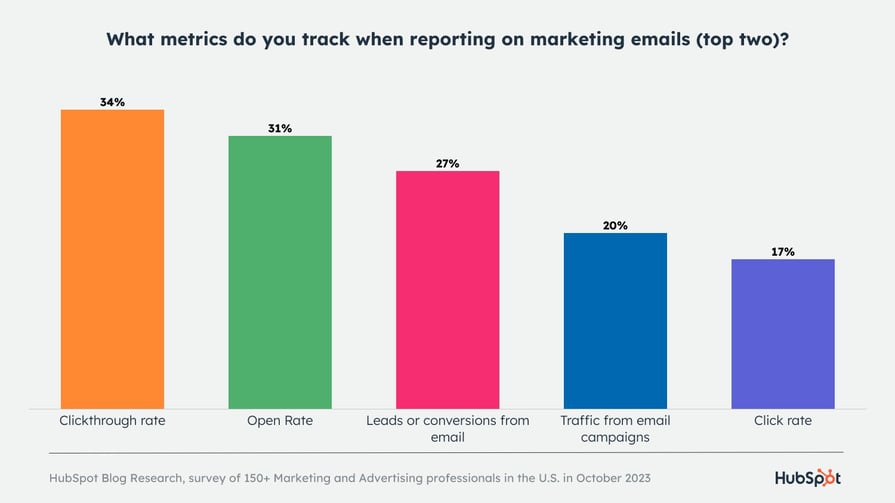
Another essential element of any company’s marketing strategy is email marketing. Email marketing remains one of the most effective ways for your business to connect with customers and build lasting relationships. With the email marketing statistics below, you’ll be able to discover how today’s marketers are using email to maximize ROI and connect with customers.

Download Now: State of Email Marketing in 2020

Clickthrough Rate

The average clickthrough rate for emails sent to Constant Contact customers is 1.40% (Constant Contact, 2023).

Marketers report that segmented emails drive 30% more opens and 50% more clickthroughs than unsegmented ones (HubSpot State of Marketing Report, 2023).

Clickthrough rate is the number one metric marketers use to track the success of their email marketing campaigns (HubSpot State of Marketing Report, 2023).

Email Copy

  • 95% of marketers who use generative AI for email creation rate it as “effective,” and 54% rate it as “very effective” (HubSpot State of Generative AI Report, 2023).
  • 43% of marketers who use generative AI say that it’s most helpful for creating email copy (HubSpot State of Generative AI Report, 2023).
  • Using customers’ names in email copy is the most common strategy marketers use to personalize their marketing emails (MailJet, 2023).
  • 47% of email recipients say they open an email based on the subject line alone, and 69% mark an email as spam based on the subject line alone (OptinMonster, 2023).

Email Segmentation

Email Usage

  • 59% of Americans say that most emails they receive are not useful to them (Edison Mail, 2023).
  • Receiving too many emails is why consumers unsubscribe (Gartner, 2022).
  • 40% of email users have at least 50 unread messages in their inboxes (MailButler, 2023).
  • The number of global email users reached 4.26 billion in 2022 and is projected to grow to 4.73 billion by 2026 (Statista, 2022).
  • 22% of marketers send two or three marketing emails per day, and 21% send daily emails (HubSpot Research, 2023).
  • Marketers report that their emails achieve the highest engagement rates between 9 AM and noon (HubSpot Research, 2023).

Mobile Email

  • 41% of email views — and 75% of Gmail users’ email views — come from mobile devices (MailButler, 2023).
  • 35% of email marketers use a mobile-first or mobile-responsive design process. (Litmus, 2023).

metricks tracked-1


HubSpot

Not Another State of Marketing

Get benchmark data from 3,400+ marketing professionals.

Check out our comprehensive resource on the current state of marketing.

Download Now

Lead Generation Statistics

Lead generation is how your business attracts and converts anyone interested in your brand, products, or services. It's an integral part of every consumer's journey to becoming a customer. With lead generation statistics, you'll discover how other marketers are using the process to reach their goals related to converting more prospects and leads into paying customers.

Download Now: Sales Conversion Rate Calculator [Free Template]

Demand Generation

  • 70% of marketers would rate their leads as being "high quality." (HubSpot Marketing Strategy Report, 2024)
  • Lead generation is the 3rd most important metric used when measuring the effectiveness of content marketing strategies. (HubSpot Marketing Strategy Report, 2024)
  • 44% of marketers say "Better measure the ROI of our demand generation initiatives" is their top priority for 2021. (Demand Gen Report, 2021)
  • More than half (53%) of marketers say webinars is the top-of-the-funnel format that generates the most high-quality leads. (Demand Gen Report, 2021)
  • 53% of marketers say email has been the most effective channel for early-stage lead generation.(Demand Gen Report, 2021)
  • In 2021, 78% of marketers say their
    demand-gen budget will grow or remain the same. (Activate, 2020)
  • 28% of marketers say using additional account-level fields helps improve their lead scoring. (Activate, 2020)
  • Ad placement and audience targeting are the top ways that advertisers drive more demand. (HubSpot, 2020)
  • The top priority for marketers is generating leads. (HubSpot, 2020)
  • Over 60% of marketers said their CAC has increased in the past three years. (HubSpot, 2020)
  • 49% of companies report that increasing customer acquisition is their primary objective. (Ascend2, 2020)

Marketing Automation

  • 64% of marketers use AI/automation and 38% of those who don't will start using it in 2024. (HubSpot Blog Marketing Strategy Report, 2024)
  • 63% of marketing leaders report that they use automation in their email marketing efforts, 50% use it for social media management, and 40% automate their paid ads efforts (Statista, 2023).
  • 91% of marketers reported that demand for automation from their business teams increased between 2020 and 2022 (Salesforce, 2022).
  • More than three-quarters of customer journeys are somewhat automated, and 10% are fully automated (Ascend2, 2023).

Marketing Analytics

  • A majority of marketers say that data is only "somewhat" important to their overall marketing strategies. (HubSpot Blog Marketing Strategy Report, 2024)
  • A majority of marketers say that the data they have about their target audiences is high quality (44%). (HubSpot Blog Marketing Strategy Report, 2024)
  • Just over half (53%) of marketing decisions are influenced by marketing analytics (Gartner, 2022).
  • 87% of marketers report that data is their company’s most under-utilized asset (Invoca, 2023).
  • 22% of social media marketers list measuring and justifying their work as a top challenge  (HubSpot State of Marketing Report, 2023).
  • Nearly one in three media planners list understanding the platforms their audiences spend the most time on and better analyzing the effectiveness of their content as their top challenges (HubSpot State of Marketing Report, 2023).
  • 26% of marketers report that decision-makers do not review the information the marketing analytics team provides, and 24% report that decision-makers reject the marketing analytics team’s recommendations or rely on gut instincts to make decisions (Gartner, 2022).

Advertising Statistics

Advertising can help you attract customers, improve brand awareness, and generate revenue. The statistics below will help you understand how consumers view paid media today and what advertising tactics work for businesses looking to attract new customers.

Adblocking

  • Marketers say that Google's planned third-party cookie phase out has had the most impact on their marketing strategy this year. (HubSpot Marketing Strategy Report, 2024)
  • In 2022, 35.7% of global internet users reported using ad blockers to block ads when viewing content online (Statista, 2023).
  • Ad blocking is most common in China, Indonesia, and Vietnam, where more than 40% of internet users use these tools to block ads (Statista, 2023).
  • People between 18 and 29 are likelier to use an ad blocker, while younger teens and older groups are less likely to block ads (Kinsta, 2023).
  • Worldwide, there are 530 million mobile ad-block users and 290 million desktop ad-block users (Blockthrough, 2023).

Display Advertising

  • 22% of marketers use display ads as part of their marketing strategy. (HubSpot Marketing Strategy Report, 2024)
  • In 2022, display advertisements accounted for 30% of all digital ad spending in the United States (Statista, 2023).
  • Nine out of ten dollars spent on display advertising in the United States are allocated using programmatic buying (Statista, 2023).
  • The retail industry spends the most on display ads, accounting for 24.7% of U.S. display ad spend (Insider Intelligence, 2023).
  • U.S. e-commerce businesses are projected to spend more than $15 billion on display ads in 2026 (Insider Intelligence, 2023).

Mobile Advertising

  • Global mobile advertising spending is expected to exceed $300 billion by 2024 (Statista, 2023). 
  • The U.S. leads the world in mobile ad spending, with an annual spend of over $150 billion (Statista, 2023).
  • China is the second largest market for mobile advertising, with an annual spend of nearly $115 billion (Statista, 2023).
  • U.S. marketers report allocating 19% of their marketing budgets to mobile advertising (Statista, 2023).
  • More than half of all global web traffic is mobile, making this an essential platform for advertisers (Statista, 2023).
  • Most marketers report that mobile devices are responsible for more than half of their annual traffic (HubSpot State of Marketing Report, 2023).

Pay-Per-Click (PPC) Advertising

  • With effective optimization, pay-per-click (PPC) advertising can yield average returns of $2 for every $1 spent — a 200% ROI (Wordstream, 2023).
  • A personalized landing page can make PPC ad campaigns 5% more effective (Ranktracker, 2022).
  • 84% of brands and marketers said they see good results with their PPC advertising campaigns (Ranktracker, 2022).

Video Advertising

  • Video ad spending is projected to reach over $191 billion in 2024 and more than $240 billion by 2028 (Statista, 2024).
  • 92% of video marketers report that video advertising provides a good ROI (Wyzowl, 2023).
  • 91% of businesses report using video as a marketing tool (Wyzowl, 2023).
  • The video platform TikTok generated $4 billion in advertising revenue in 2022, and its revenue is expected to double by 2024 (Statista, 2023).

Marketing Technology Statistics

Marketing technology impacts how you reach your audience, how they consume your content, and how they interact with your brand. As such, it’s critical to stay on top of the latest marketing technology trends. The statistics below highlight the best ways to connect with your audience and customers through various applications, software, and mobile channels.

Get HubSpot's Free CRM Now

Messaging Apps

  • 25% of marketers are leveraging Mobile messaging. (HubSpot Blog Marketing Trends Report, 2024)

  • 60% of consumers prefer messaging over email or phone calls (Spectrm, 2023).
  • There are over 3 billion active users on messaging apps worldwide (Exploding Topics, 2023).
  • Every month, two billion users access the leading messenger app, WhatsApp (Statista, 2023).
  • 70% of consumers have opted in to receive texts from businesses, and 61% say they want the ability to text a business back (SimpleTexting, 2023).
  • Most consumers check their text messages within five minutes of receiving a notification, and one in three consumers check their messages within one minute (SimpleTexting, 2023).
  • 65% of consumers use social media messaging apps to contact a company’s customer service team (HubSpot Research, 2023).

Augmented Reality

Mobile

  • There are nearly 7 billion smartphones worldwide, and 95% of Americans have access to a cell phone (Exploding Topics, 2023).
  • More than 60% of global website traffic is mobile (SimilarWeb, 2023).
  • 74% of people report that they are more likely to return to a website if it’s optimized for mobile (WebFX, 2023).
  • 67% of mobile users say they’re more likely to buy a company’s product or service if its website is mobile-friendly (WebFX, 2023).
  • More than half of all digital ad spending is focused on mobile ads (Statista, 2023).
  • Social media ads receive the largest portion of global mobile advertising investment, with marketers spending over $140 billion on mobile social media advertising in 2023 (Statista, 2023).
Want to access statistics like this and more? Download the report below.

Sales Statistics

A strong relationship between marketing and sales is critical to success. When your sales team is up to date on everything the marketing organization does, people will be empowered to sell more effectively and efficiently — ultimately helping you boost conversations and sales.

Download our Canadian research report that examines top sales and marketing trends shared by 3,400+ marketers and 500+ global sales leaders.

CRM

  • 61% of sales leaders automated their CRM software in 2023 (Prezentor, 2023).
  • 78% of sales leaders say their CRM effectively improves alignment between sales and marketing teams (HubSpot Research, 2023).
  • Top-performing salespeople spend about 18% more time updating their CRM system than average salespeople (LinkedIn, 2022).
  • 91% of companies with ten or more employees use a CRM system to manage customer data (Zippia, 2023).
  • 45% of companies report that their use of CRM software has increased sales revenue (Zippia, 2023).

Selling

  • Global retail sales are projected to amount to more than $30 trillion by 2026 (Statista, 2023).

Service Level Agreement (SLA)

  • 85% of marketers with a service level agreement (SLA) believe that their marketing strategy is effective (HubSpot Research, 2023).
  • Companies with an active SLA are likely to experience greater year-over-year ROI than those without (HubSpot Research, 2023).
  • Companies with an active SLA are 31% more likely to hire additional salespeople to meet demand (HubSpot Research, 2023).

Social Selling

  • 78% of businesses that use social selling outperform those that don’t (LinkedIn, 2023).
  • Businesses that prioritize social selling are 51% more likely to reach their sales quotas (LinkedIn, 2023).
  • Sales professionals with a strong social selling index on LinkedIn have 45% more sales opportunities than those without a strong social selling index (LinkedIn, 2023).
  • When people are exposed to brand messages on LinkedIn, they are six times more likely to convert (LinkedIn, 2023).
graphic displaying that CRMs are key to marketing and sales alignment

Get Inspired by Marketing Stats

Keeping up with the latest trends and processes in the world of marketing may seem like a daunting task.

After all, it’s an industry that never stays still — new marketing technologies and best practices are constantly developing and evolving. But by staying on top of the latest marketing statistics, you’ll be empowered to lead your team to success and keep your business ahead of the curve.

No matter what your business is focused on or what your goals are — whether they’re related to SEO, content marketing, social media, video marketing, email marketing, lead generation, advertising, marketing technology, or sales — reading up on the latest stats within each category is a great way to ensure your marketing tactics stay relevant. 

Download Our Latest Research


2020 Not Another State of Marketing Report

A new report to help marketers prioritize their strategies and outperform their goals. Data from over 3,400 marketers across the globe. Insights and predictions from our leading people and partners. Take a look inside

Read More About Marketing Statistics on HubSpot's Blog