Logo - Full (Color)
Skip to content

BCG Matrix for Excel, Google Sheets, PDF

Strategically manage your company's products with the help of the BCG Matrix.

Download Free Template

Available for Excel & Google Sheets & PDF

Template Highlights

  • Consider the growth and market share of your products to determine their category according to the Boston Consulting Group (BCG) methodology.
  • Access the template in Excel, Google Sheets, or PDF format.
  • Identify the best and worst performing products in terms of their return on investment.
  • Design strategies tailored to each product to maintain or improve their commercial performance.
  • Print the template in your desired format or share it via email.

Frequently Asked Questions

The BCG Matrix, also known as the Boston Consulting Group Matrix, is a strategic management tool used to identify the best and worst performing products in terms of return on investment (ROI).

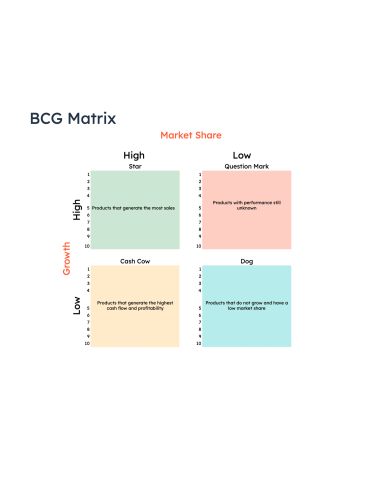
Make a list of your products and categorize each one into the appropriate quadrant: products that grow above the market average can be placed in the 'Question Mark' or 'Star' quadrant, while those with lower growth can be placed in the 'Dog' or 'Cash Cow' quadrant. The 'Question Mark' product has market potential but requires investment, unlike the 'Star' product, which is a market leader. The 'Dog' product is no longer profitable for the company, and the 'Cash Cow' product is well-established in the market but less successful than the 'Star' product.

Certainly!

Yes, it is completely free.