Template Highlights
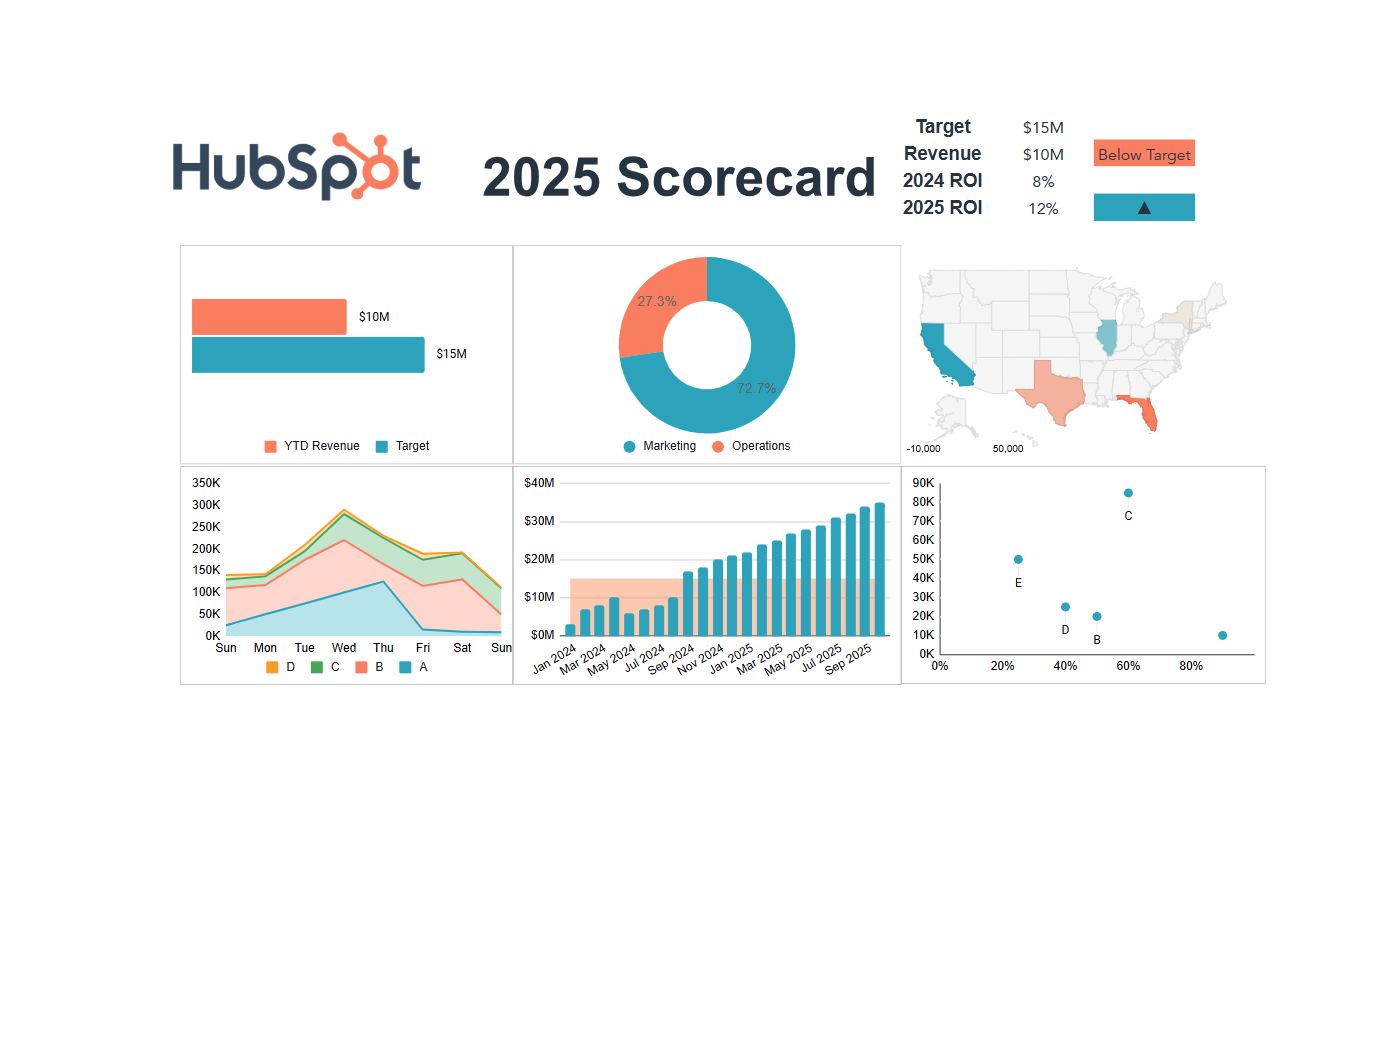
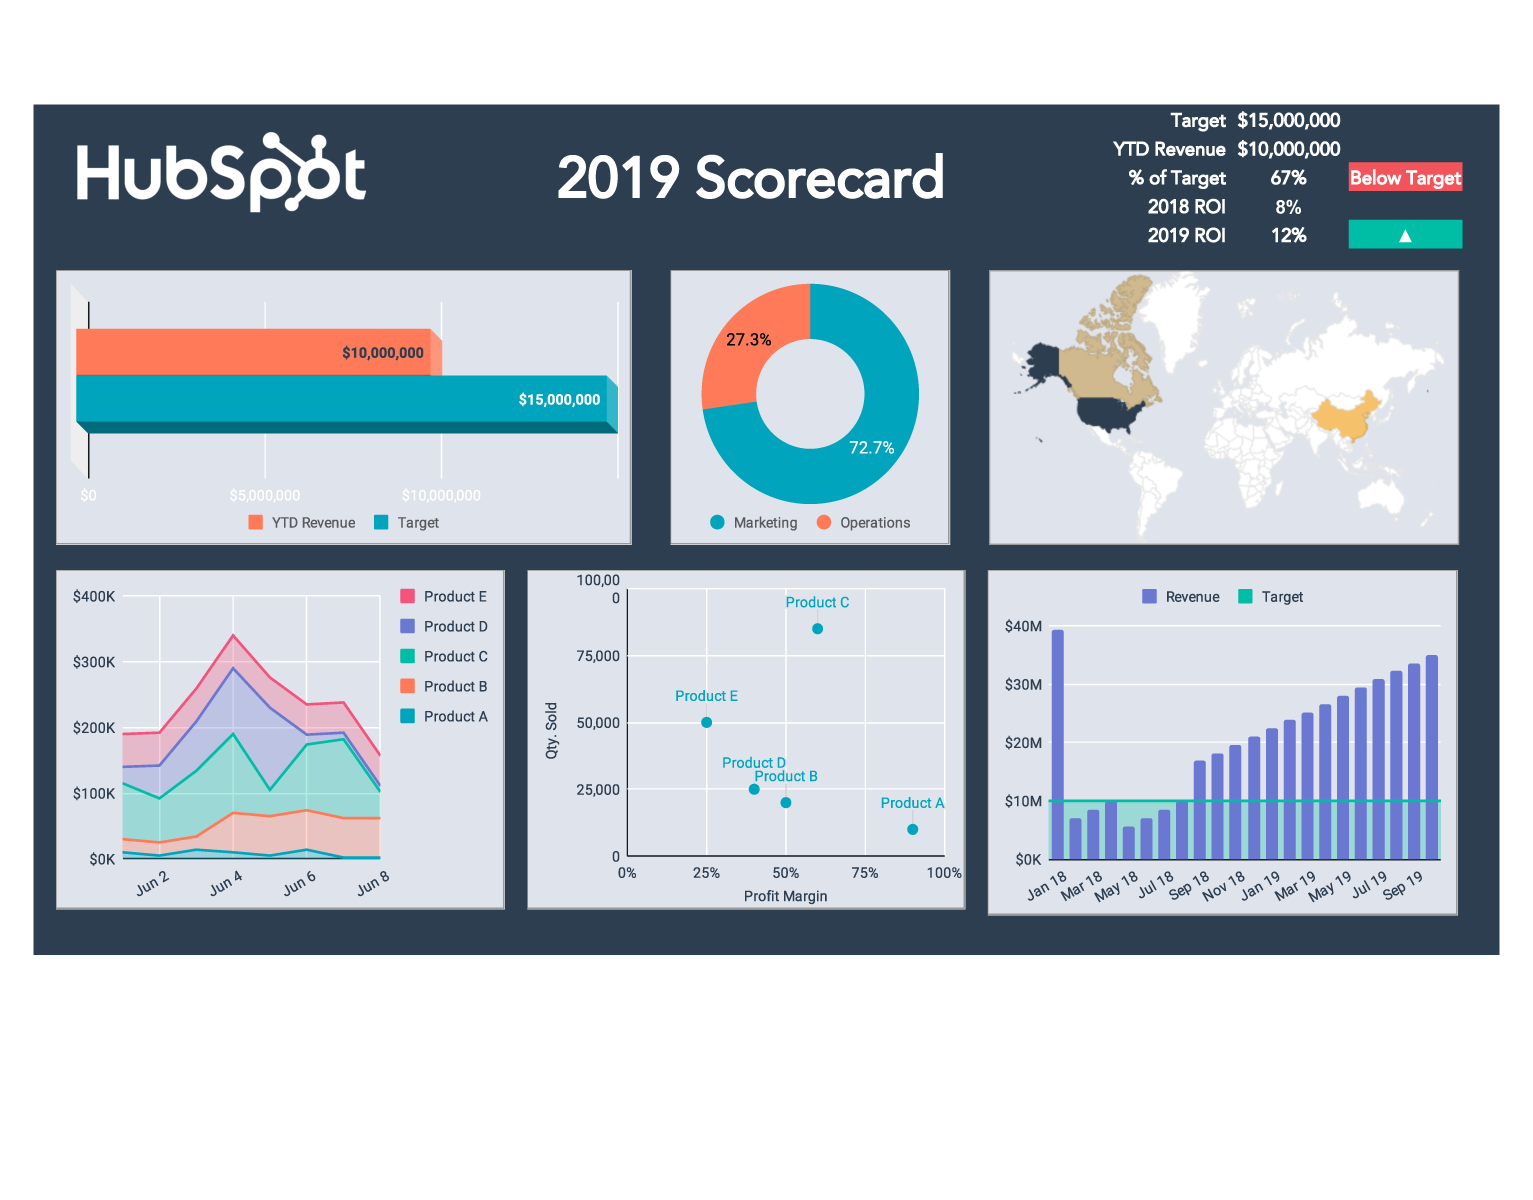
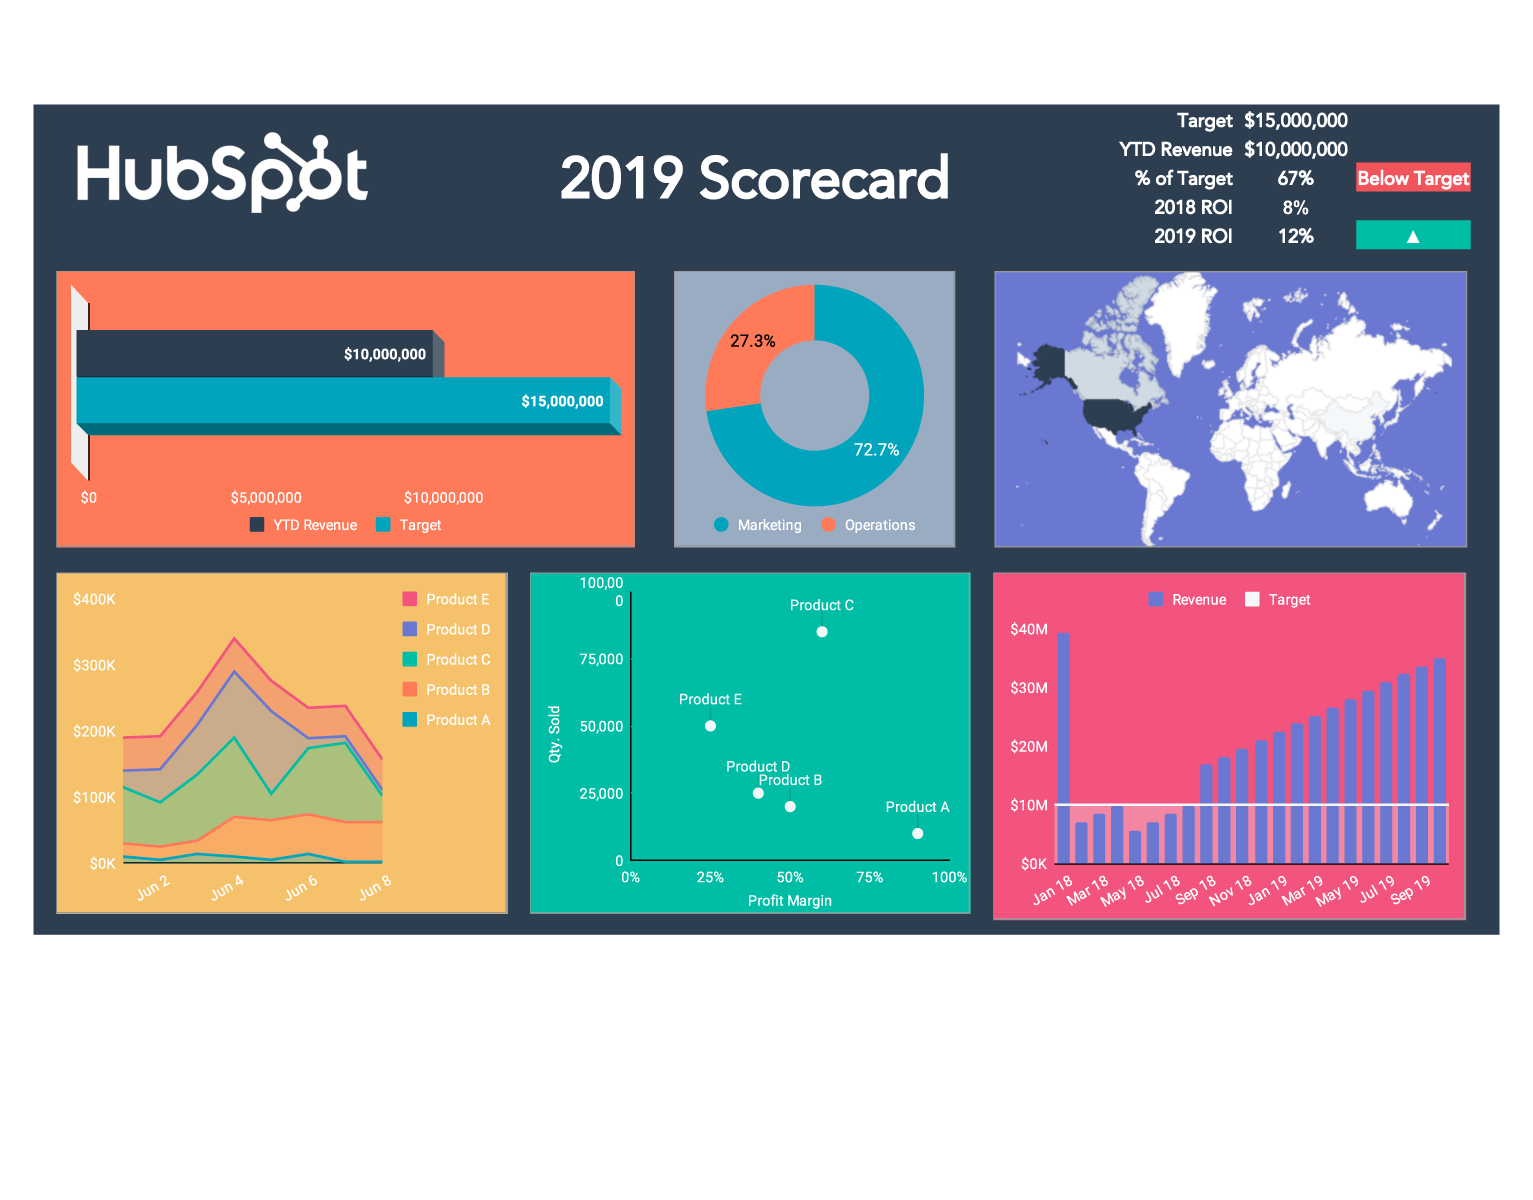
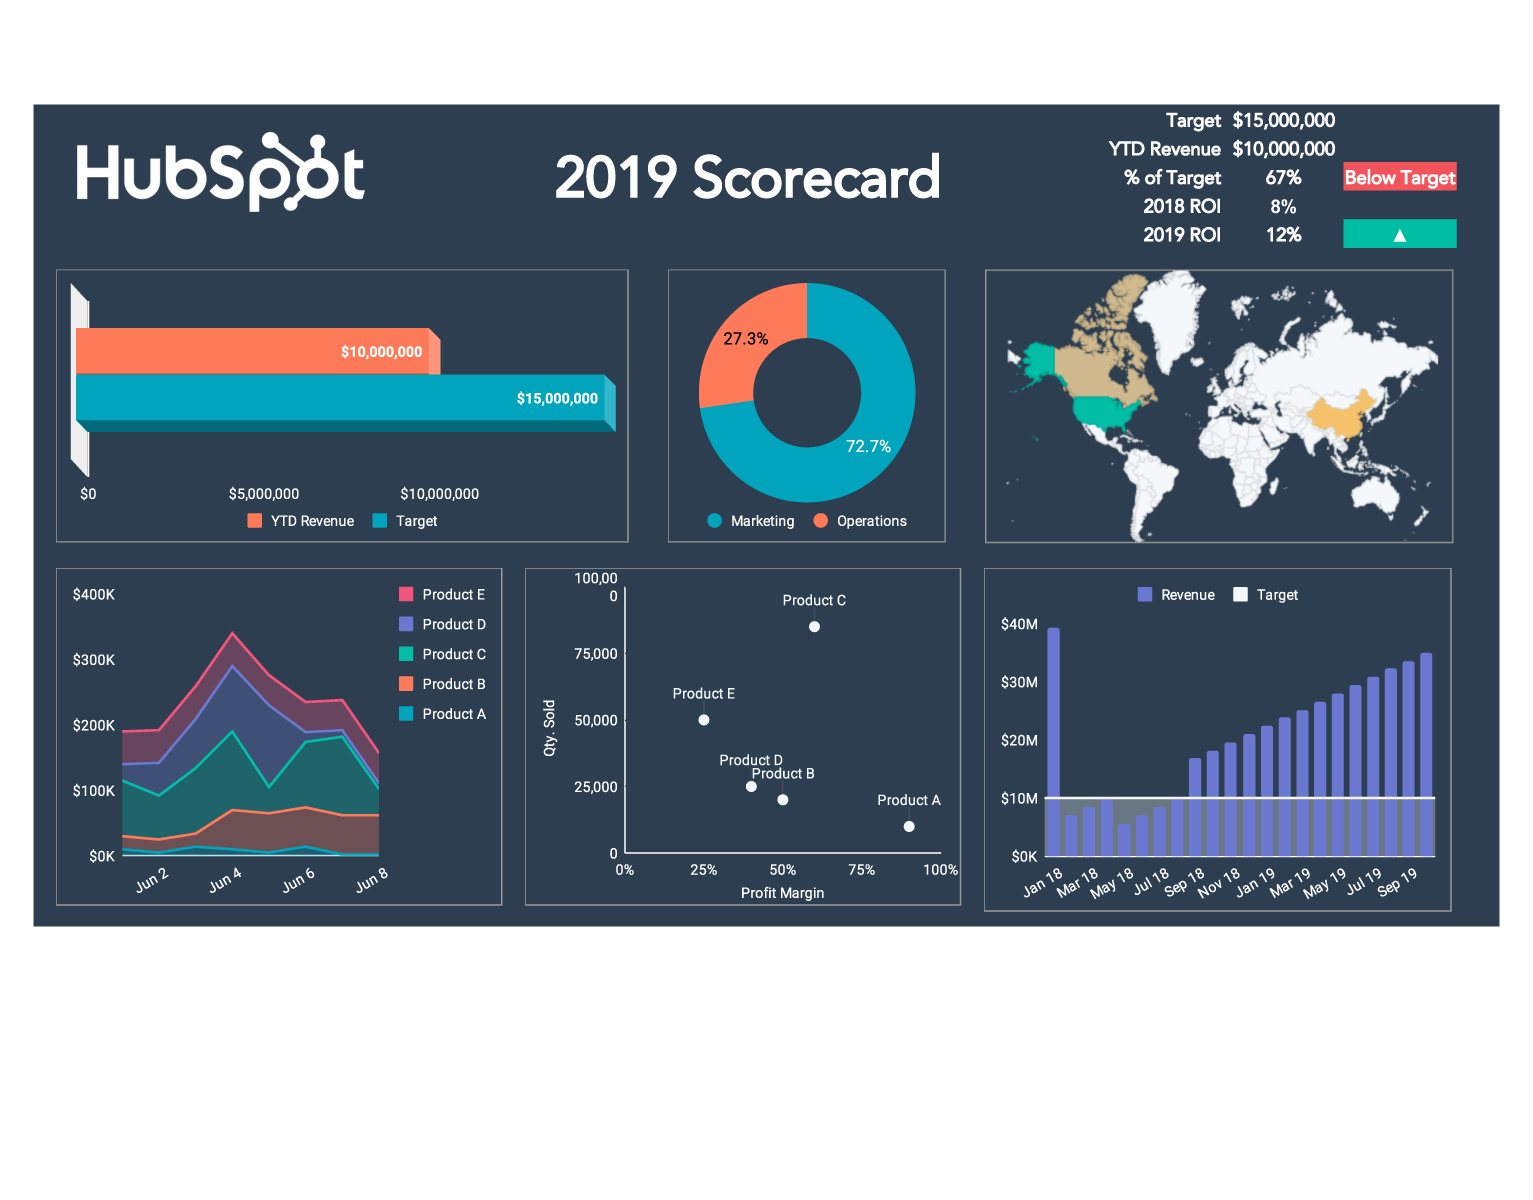
- Track your most important KPIs in one visual dashboard. See all critical metrics at a glance - no digging through multiple spreadsheets
- Learn dashboard design before investing in software. Understand data visualization fundamentals with 3-6 months of hands-on practice
- Professional charts update automatically: input your data once, graphs and gauges refresh instantly
- Easy to customize for any department: works for sales, marketing, executive, or financial KPIs


