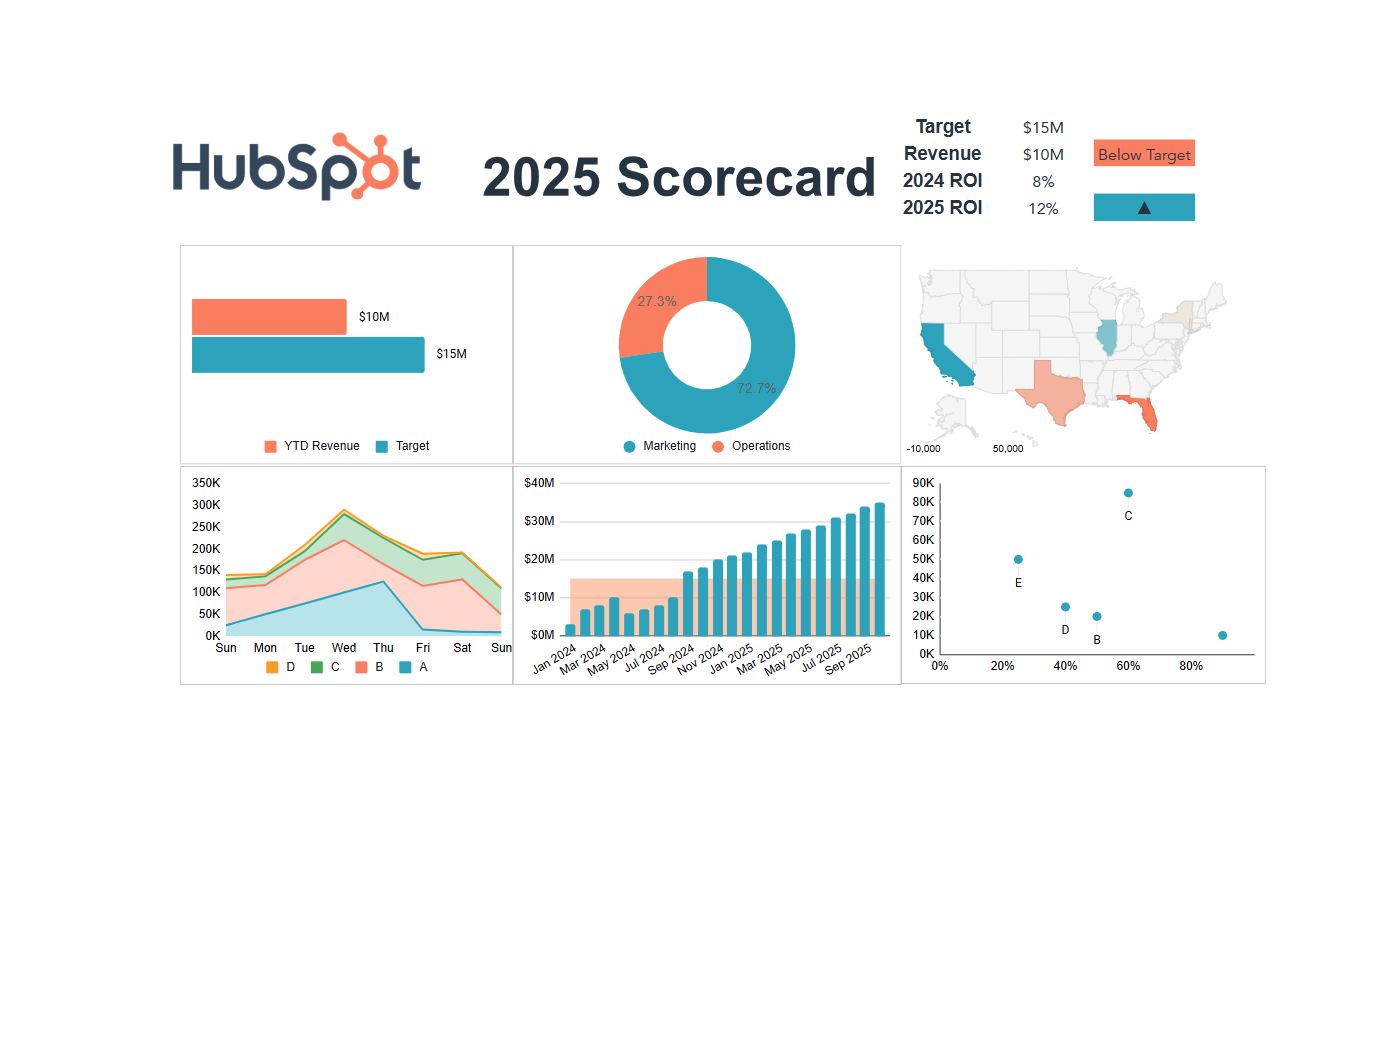
KPI Dashboard for Excel, PDF
Download Free Template
Available for Excel & PDF
Your download is available!
Click to download your document template in the format you need.
Your download is ready!
Download KPI Dashboard for Excel & PDF or email it to yourself later.
Download KPI Dashboard for Excel & PDF.
Looking for more free features?
Create a free Hubspot AccountEffortlessly integrate your data, teams, and customers on one AI-powered platform that scales with your business.
Plus, you've unlocked access to 136 hand-built business templates!
Template Highlights
- Download this KPI dashboard template as an Excel workbook or a PDF.
- The Instructions tab in the Excel workbook contains detailed instructions on adding your company data to adjust the KPI graphics.
- Adjust the values in the Instructions tab to create new graphics.
- The graphics will update automatically when you update the data.
Benefits of KPI dashboards
KPI dashboards are more than a way to show off your design skills. They can help you:
- Access data conveniently: With KPI dashboards available in PDF and Excel, you can access them on the go from a smartphone, tablet, or laptop.
- Stay proactive: By regularly checking and updating your KPI dashboard, you can identify performance issues early to prevent them from spiraling.
- Make better decisions: When valuable data is boiled down to essential elements, you can make more informed business decisions.
- Retain the focus on KPIs: Visual dashboards put your KPIs front and center, reminding you of their importance for successful business operations.
- Communicate and collaborate: KPI dashboards are effective tools for meetings. They can help you communicate your company’s performance with key stakeholders (e.g., team members and managers) and get everyone’s input on how to improve it.
How to use HubSpot’s free KPI dashboard template
HubSpot’s KPI template can be opened with either Excel or a PDF viewer—all you have to do is download it in your preferred format.
Here’s how to use and edit your KPI dashboard in Excel:
- Download the KPI template for Excel and click Enable Editing.
- Review the visual elements in tabs 1–4 before adding your own data.
- In the Instructions tab, you’ll find instructions on how to use the KPI dashboard. Follow these carefully to ensure your dashboard looks and functions as expected.
- Change the values in the Instructions tab to your company’s KPI results. The changes will automatically be applied to your dashboard’s visual elements, such as graphs and charts.
- Print the KPI dashboard, send it to colleagues via email, or add it to meeting slides.
How to select key performance indicators for a KPI Template
It’s easy to get overwhelmed by the sheer amount of data that might be relevant to your business goals. To ensure you maintain focus on the most important performance metrics, choose only a limited number of KPIs.
Next, you’ll want to add the relevant data to a KPI dashboard and review its visual elements, such as graphs and bar charts. A visually appealing KPI dashboard lets you get to the heart of KPI data quickly to start putting it to work.
Frequently Asked Questions
For example, you may want to boost revenue, retain customers, or gain a competitive advantage.
Related Tags:
Get this template for free!