Resource Library
Featured Resources
-
Guides
 Marketing
The 2025 State of Marketing Report
Discover the strategies shaping 2025 and how data-driven decisions are redefining success.
-
Tool
 Brand Marketing
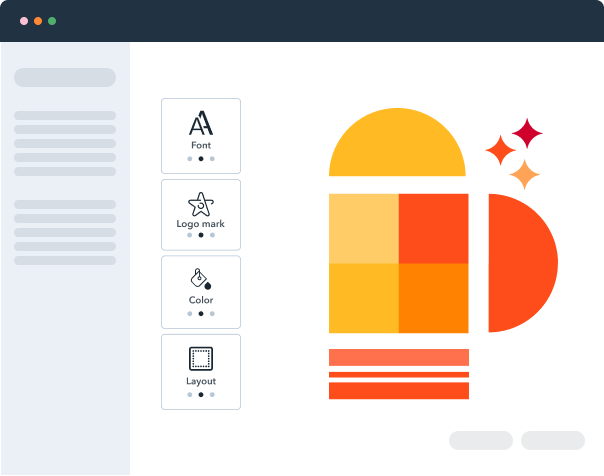
Brand Kit Generator & Identity Design
Create custom logos, icons, and color palettes in an instant to build a unique online presence for your business!
-
Kit
 Marketing Automation
20 Prompts to Scale Your Marketing Without Scaling ...
Maximize your marketing impact with minimal resources using this collection of battle-tested AI prompts.
-
Template
Google Sheets
 Sales Process
Sales Leader's AI Disruption Database
Identify early signals, anticipate objections, and position your solutions effectively in an AI-disrupted market.
-
Guides
 Sales Strategy
Cold Calling Essentials
Access to a script template and objection handling responses that top-performing SDRs use to book meetings.
-
Kit
.png) Sales Email
Sales EmailThe ChatGPT Sales Email System: 80 Ready-To-Use Prompts
This guide shows you how to prompt ChatGPT to write personalized, response-worthy emails that get replies.
-
Guides
 Customer Feedback, Marketing Automation
Use AI to Decode Customer Feedback in Minutes
This free guide walks you through a 5-step AI-powered process to extract, analyze, and apply customer insights.
-
Template
Excel
 Customer Success
Net Promoter Score (NPS) Kit
Take control of your customer loyalty metrics with our complete NPS template + calculator.
-
Template
PDF
 Customer Experience, Customer Satisfaction
Customer Onboarding Templates
Eight templates to lead your new customers through their first several months with your product or service.
-
Guides
 Personal Branding and Development
Turn ChatGPT Into Your Executive Coach
See how Sam Parr trained ChatGPT to become his advisor on everything from revenue optimization to life decisions.
-
Guides
 Sales Management
How to Motivate & Manage Millennials
Hear from experts, leaders and Millennials on their own coming-of-age story and what actually drives Millennials ...
-
Guides
 Sales Communication
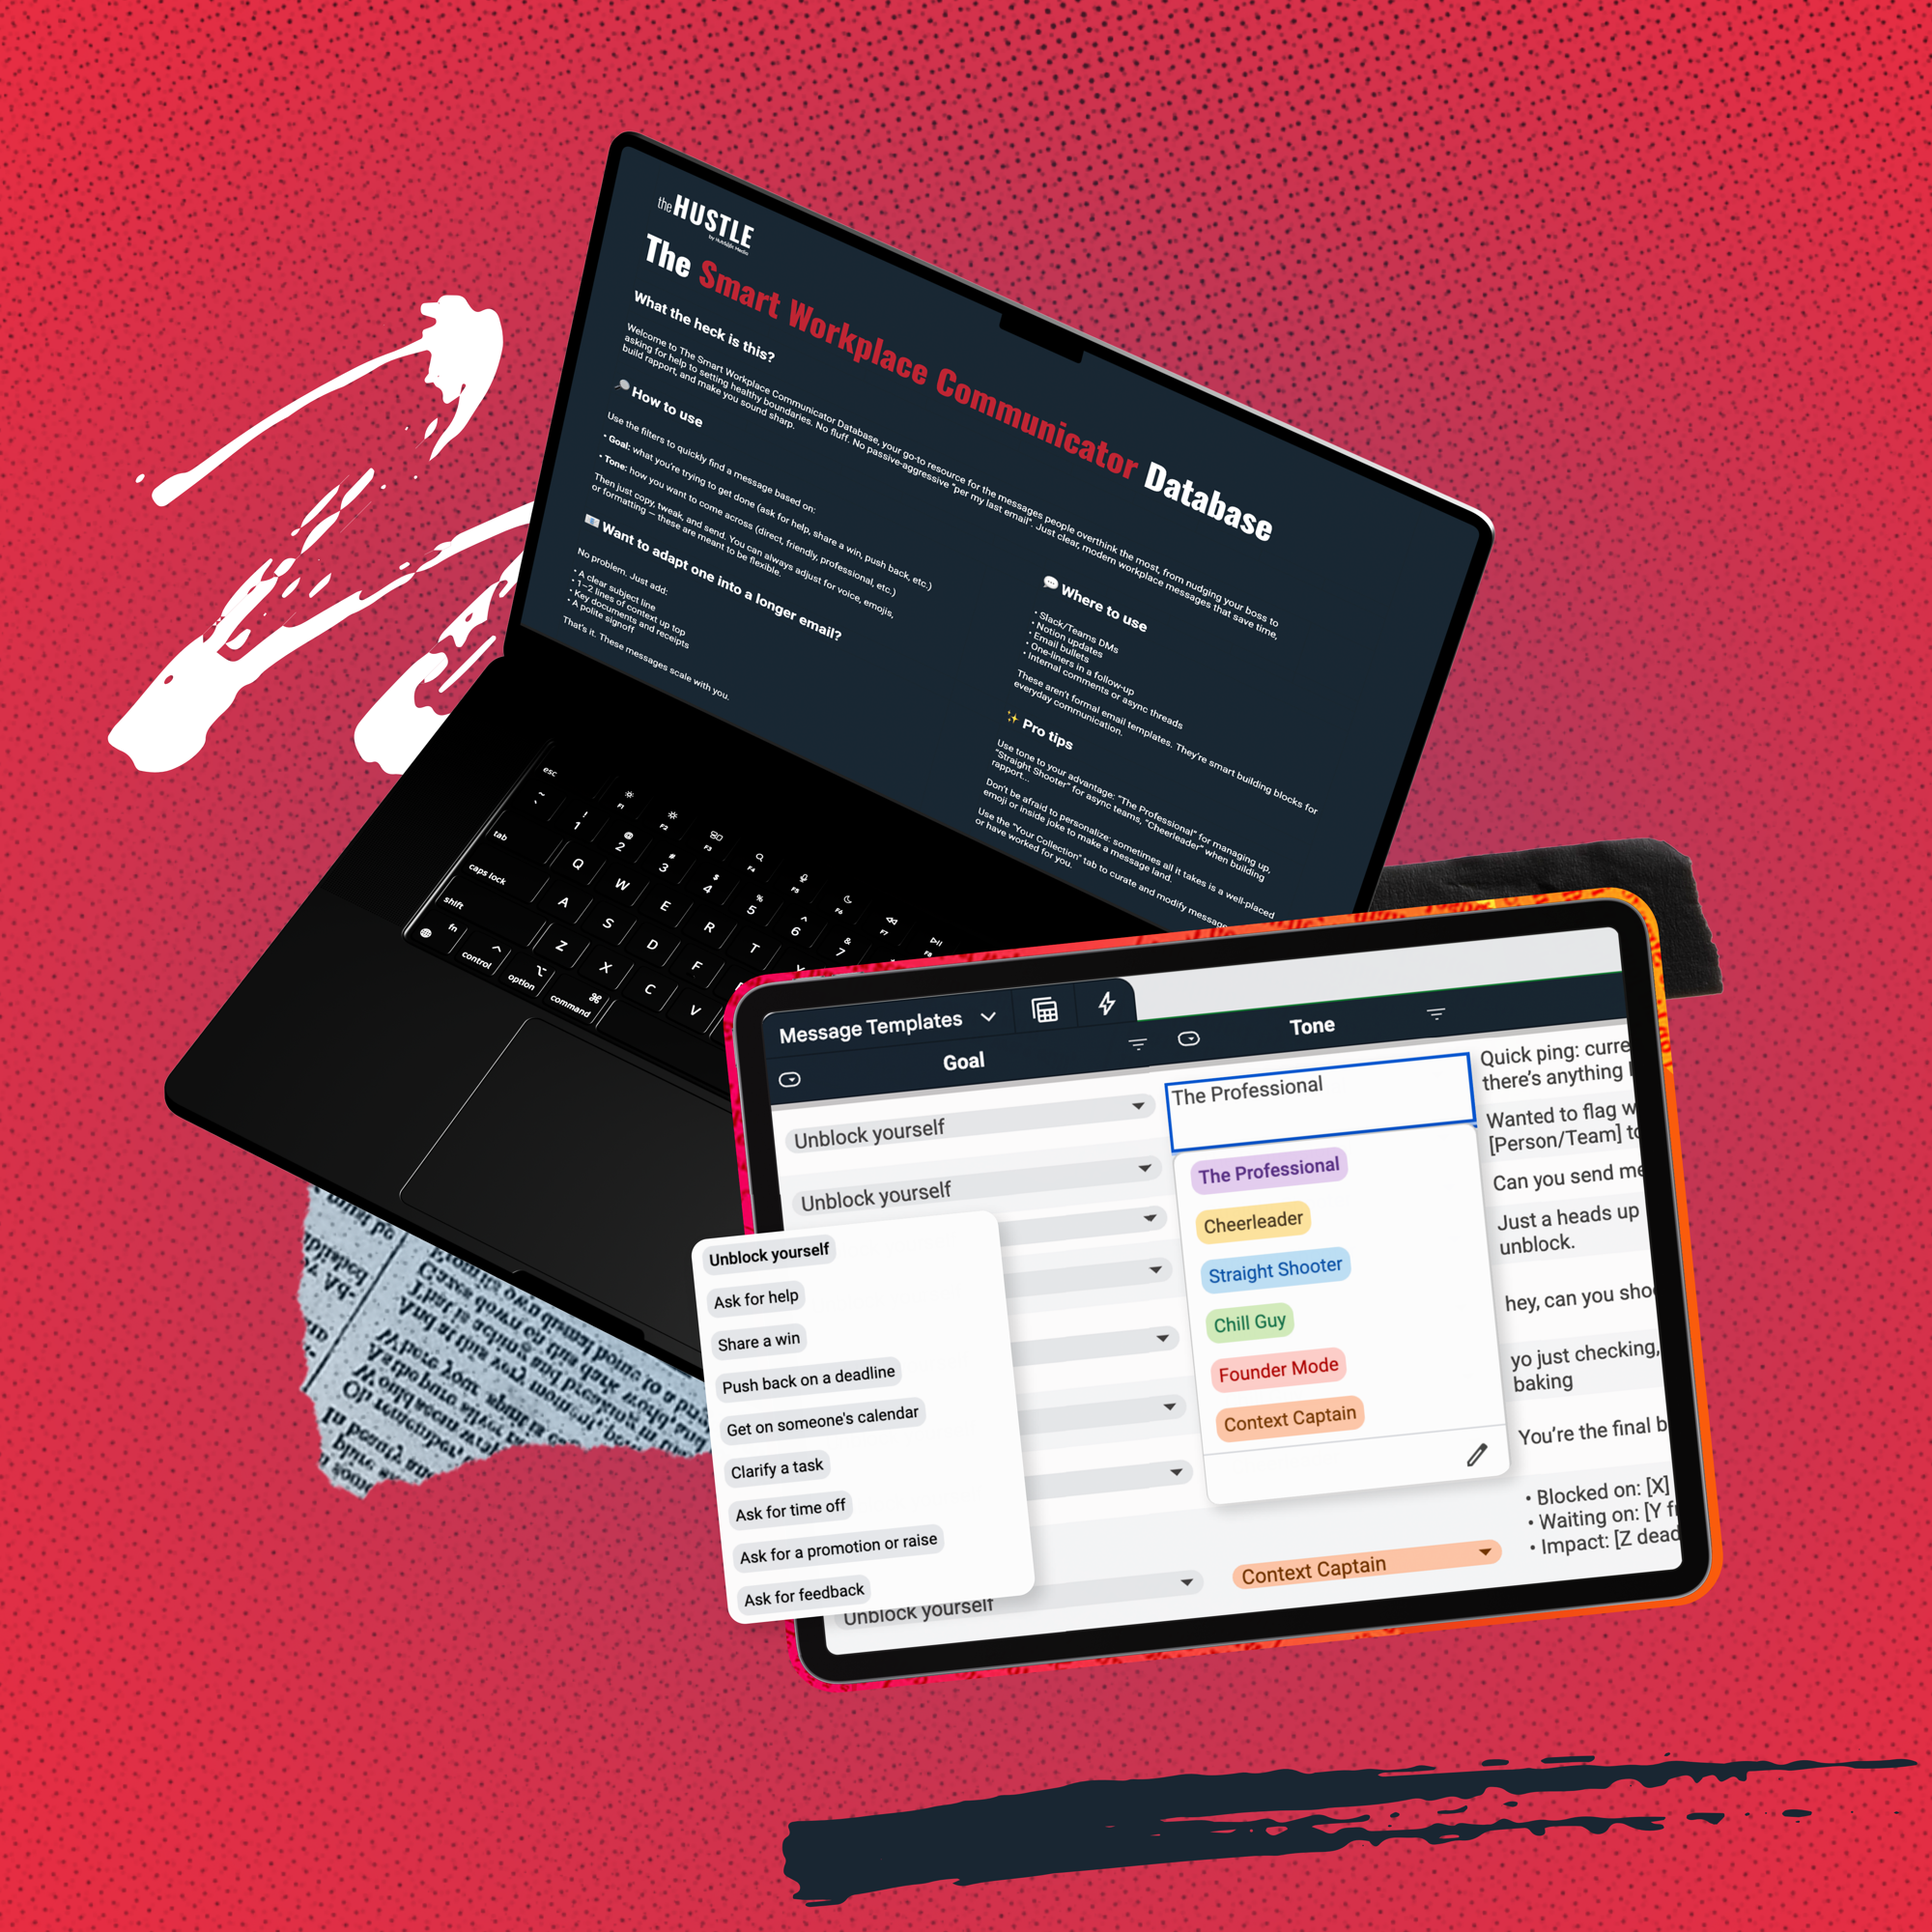
The Smart Workplace Communicator Database
Say what you mean, sound like a pro, and get people on your side with words that work.
-
Ebook
PDF
 Marketing, AI
The State of AI in 2025
A report featuring data from over 1,000+ marketers packed with insights for 2025 on the ever-evolving AI landscape.
-
Tool
 Brand Marketing, AI
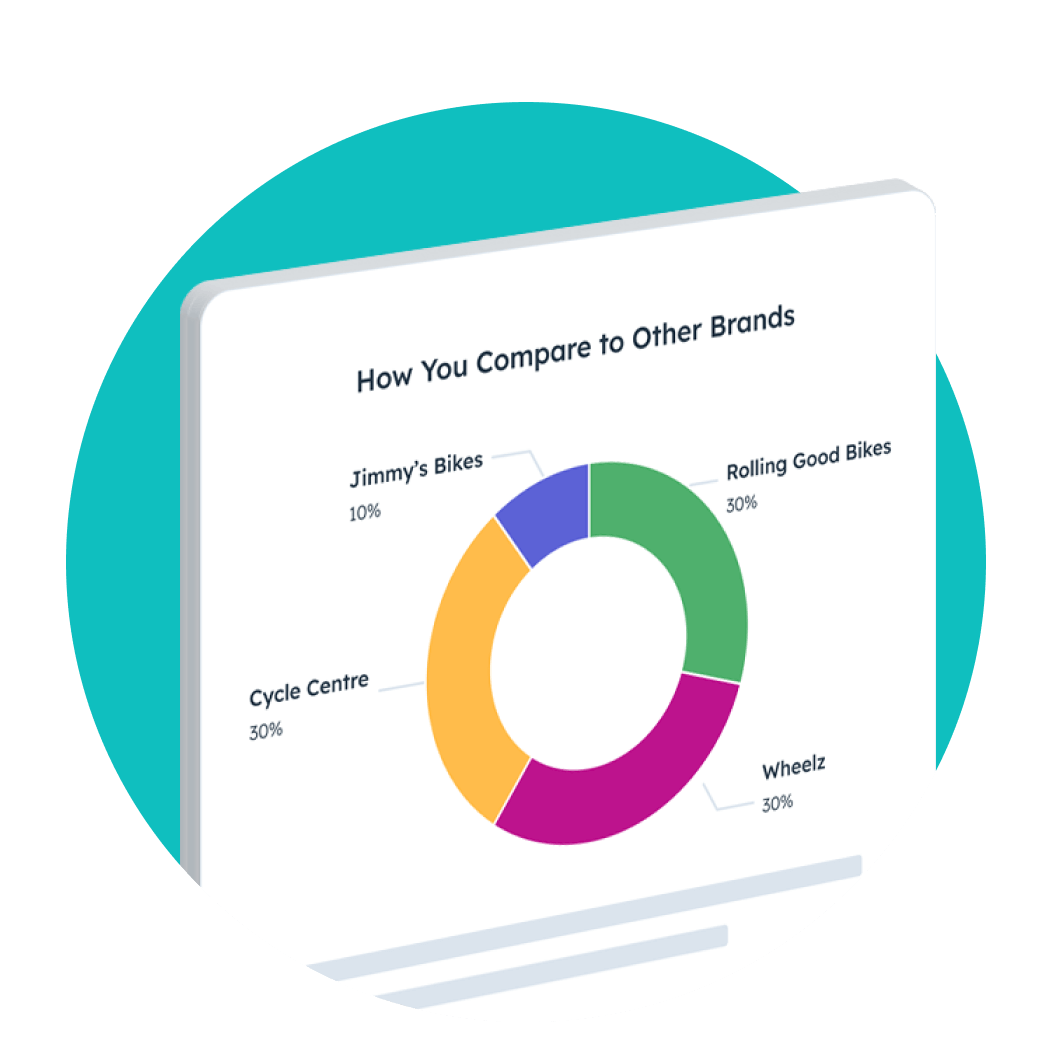
AI Search Grader
See how visible your brand is in AI-powered search engines.
-
Ebook
 Marketing Automation
Master AI Agents in 2025
Unlock unprecedented efficiency with human-AI partnerships that deliver measurable results.
Free Template Resources for Project Management
Explore 22 Template resources for Project Management
Showing 1 - 12 of 22
-
.png)
Template
Google Docs
Business, Project Management, SalesSOP Template A standard operating procedure (SOP) is a document that outlines how a particular process is handled. Use our SOP template to develop your in-house SOPs.Template
Google Docs
-
Template
Excel
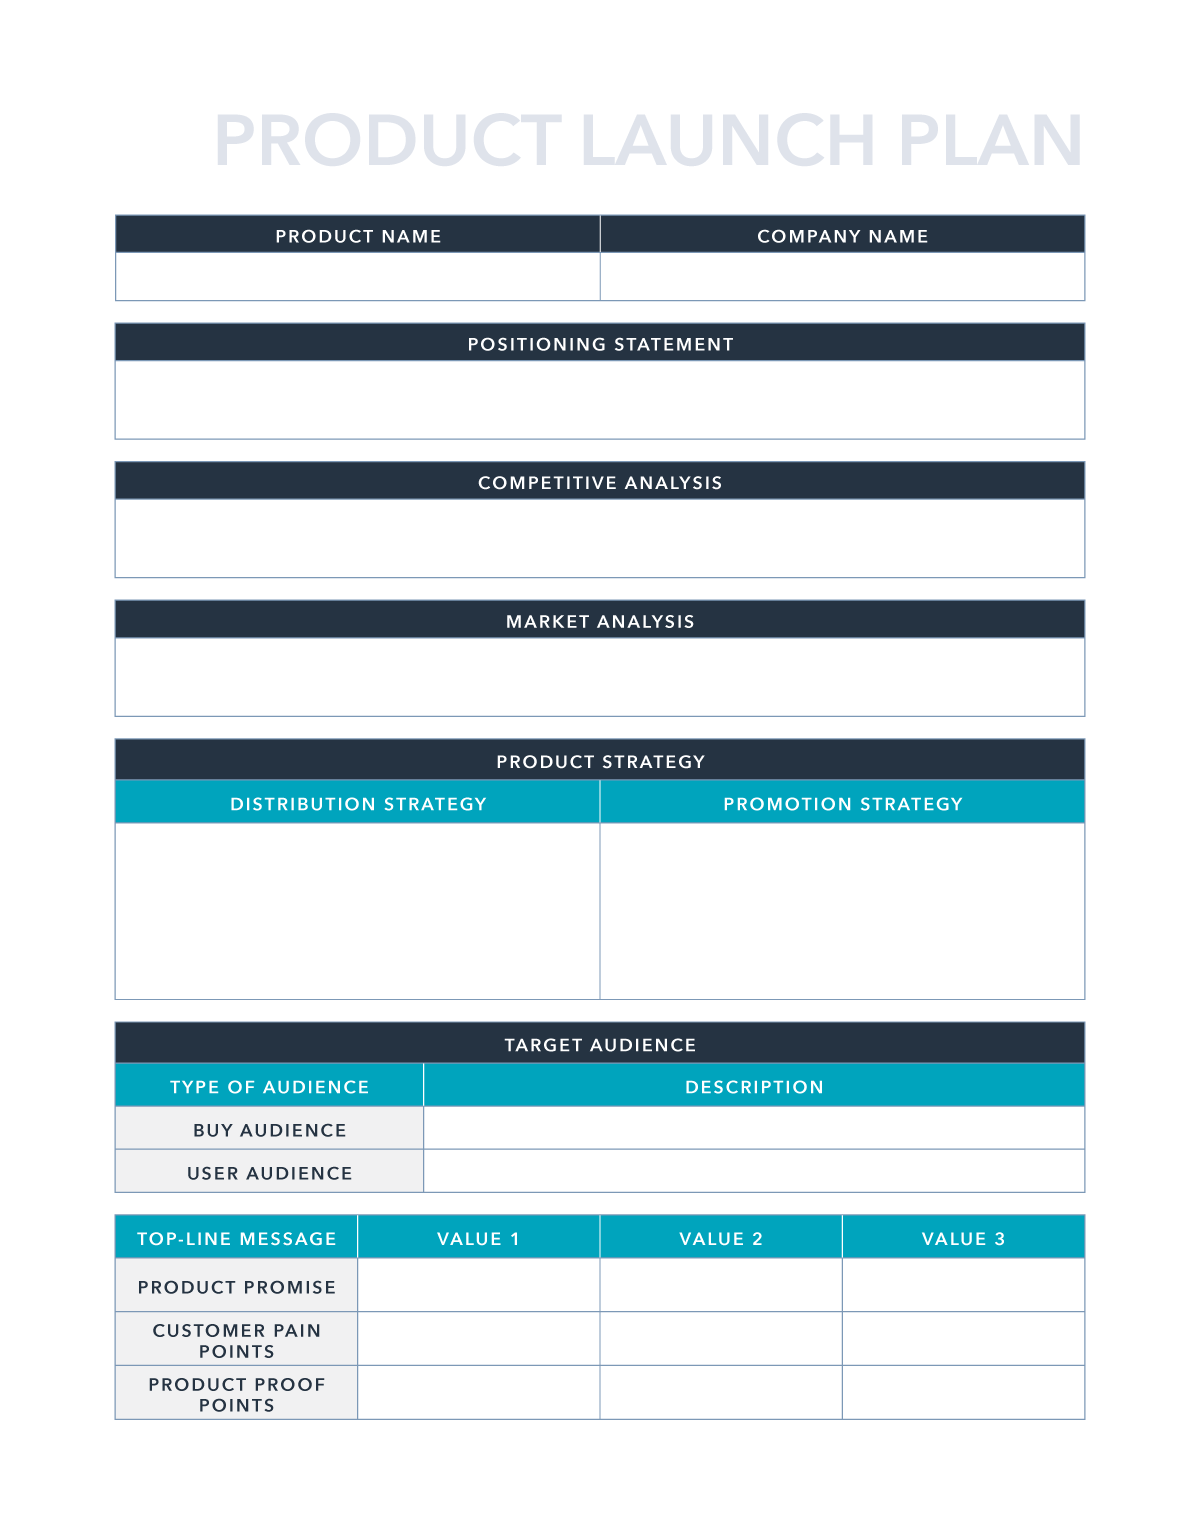
Project ManagementProduct Launch Plan Template Plan successful product launches with our Product Launch Plan Excel, PDF & Google Sheets template. Download free and strategize for impact and engagement.Template
Excel
-
.png)
Template
Excel
Project ManagementFree Root Cause Analysis Template This free root cause analysis template walks you through analyzing a business incident, identifying the source, and finding actions to remedy it.Template
Excel
-
Template
Excel
Project ManagementProject Schedule Template Use our project schedule template to keep your team on track and meet deadlines efficiently.Template
Excel
-
.png)
Template
Google Sheets
Project Management, Artificial IntelligenceAI Task Delegation Playbook Are you ready to unleash the power of AI to optimize your workflow and save precious time? This bundle of templates is designed for individuals like you to streamline task delegation and enhance productivity through AI technology.Template
Google Sheets
-

Template
Excel
Project Management, StartupsEisenhower Matrix Template Prioritize tasks effectively with our guide on the Eisenhower Matrix template for Excel & Google Sheets. Focus your activities on importance and urgency.Template
Excel
-
.png)
Template
Google Docs
Business, Project ManagementScope of Work Template Want to define a scope of work for all project stakeholders? Use HubSpot’s free scope of work template for Word and PDF to get started immediately.Template
Google Docs
-

Template
Google Docs
Project ManagementProject Plan Template Stay on schedule and within budget with our Project Plan template for Word, PDF, and Google Docs. Download for free and set your project up for success.Template
Google Docs
-
Template
Google Docs
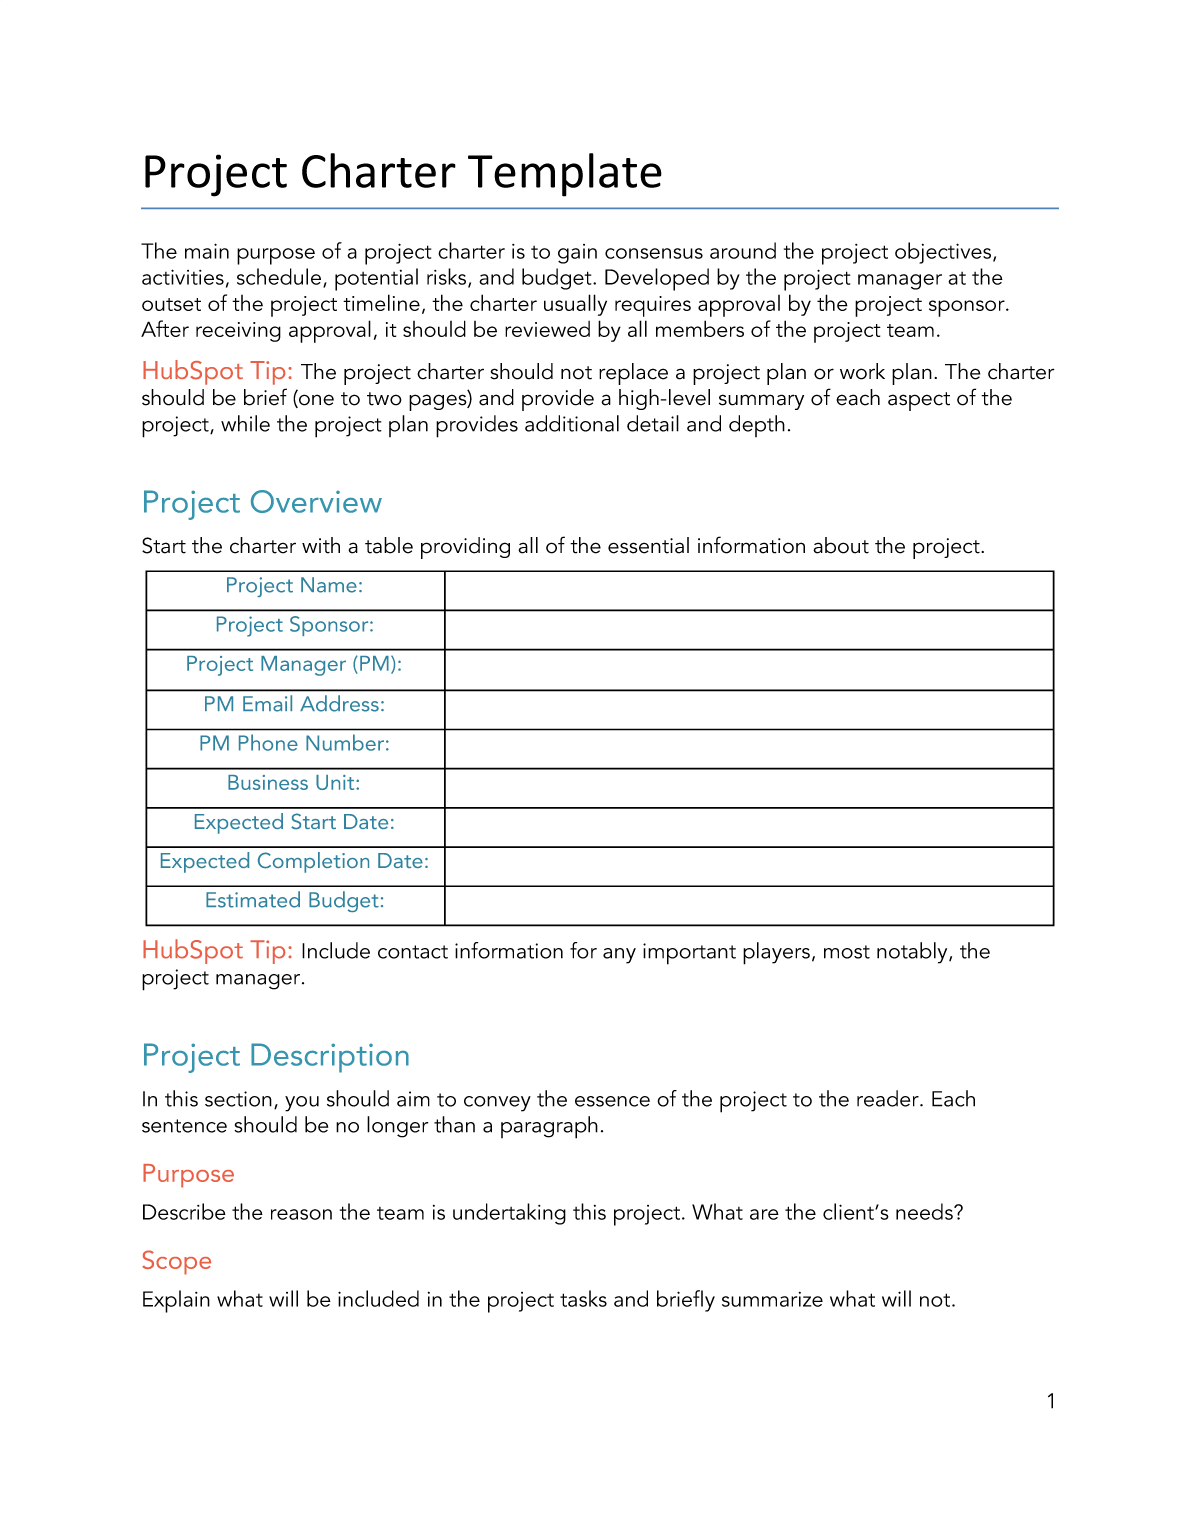
Project ManagementProject Charter Template Make sure your team is on the same page with our free Project Charter template for Word, Google Docs & PDF. Download to establish a solid foundation.Template
Google Docs
-
Template
PDF
Project Management, Proposals Estimates & Quotes, Agencies, StartupsProject Proposal Template Get the green light for your idea with our free Word & PDF Project Proposal template. Download to craft compelling proposals that showcase your project.Template
PDF
-

Template
Excel
Project Management, StartupsRACI Matrix Template Clarify roles using our RACI matrix template. Improve team accountability and communication.Template
Excel
-
Template
Excel
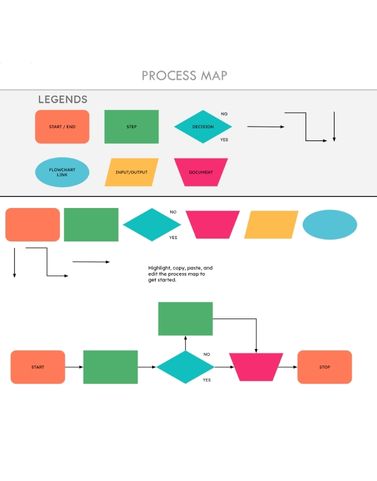
Project ManagementProcess Map Template Identify inefficiencies, develop tailored strategies, and collaborate for improvement with HubSpot's process map template. Click to download now.Template
Excel
No Results

Get your free CRM today
Found the resources you need? Take the next step. Start unifying your customer data today with an easy-to-use, AI-powered free CRM that works as hard as you do.
With HubSpot's CRM, your customer database is accessible to both sales and marketing teams to generate and nurture new prospects. Keep all your information up-to-date and at your fingertips to increase conversion rates and turn insights into results.